Preferred Site Allocations 2018
Part One: Our Strategy for Growth
(16) Vision
- We are committed to enabling new growth in the borough that meets our development needs, but in a way that maintains and enhances our unique local character. Brentwood is a borough of villages. People choose to live and work here because of the excellent transport links connecting us to London and the rest of the country, along with access to the surrounding countryside and green spaces. Future growth will be in line with this.
- As the plan progresses we have continued to review and update our vision. It remains strongly aligned to the vision first detailed in the Draft Local Plan (2013-33).
"Brentwood Borough will continue to be a thriving, attractive and unique destination in which to live, work, and visit. We will continue to protect our key assets including the environment, heritage and character of the Borough but also maximise opportunities to meet our housing needs for current and future generations and provide the right economic environment for high quality investment.
Brentwood and Shenfield centres will provide a focus for retail, quality employment and exciting arts and cultural opportunities with super connectivity to and from London via Crossrail. The Borough will continue to thrive with a high-quality network of green infrastructure, parks and new connected green corridors, providing cycling and walking opportunities for all. A 'borough of villages' will continue to be a defining characteristic of the area.
Brentwood will grow sustainably with new development directed to urban brownfield opportunity sites, well planned urban extensions and key transport corridors. Dunton Hills Garden Village will provide a sustainable new community and service centre with significant investment in homes, employment, community and recreational facilities supported by a wide range of infrastructure, including schools and public transport."
(23) Strategic Objectives
- Our strategic objectives support our vision, and have been fine tuned to reflect consultation feedback, the evolving evidence base and new national planning policy directions. These refreshed strategic objectives are detailed in Figure 3. Our updated strategic objectives place an enhanced focus upon engraining growth ambitions around Dunton Hills Garden Village and ensuring that community infrastructure and sustainable transport remain central to our plan-making.
(10) Figure 3 – Strategic Objectives

(222) Spatial Strategy
- The spatial strategy for Brentwood Borough provides the context for managing change and shaping how the area develops in the future. The strategy sets out the level and location of development and provides the basis for delivering our vision, strategic objectives, planning policies and land allocations. The spatial strategy should be underpinned by a need to deliver sustainable development.
- Representations received in response to the Draft Local Plan (2016) consultation questioned how the spatial strategy had been developed and what underpinned the selection of strategic growth options, including Dunton Hills Garden Village. The Sustainability Appraisal accompanying this consultation includes an enhanced focus on the current settlement hierarchy and a clearer narrative on the assessment of reasonable growth alternatives, and what are not considered reasonable alternatives. This informs how we have arrived at the proposed spatial strategy.
- The spatial strategy continues to focus upon the sequential use of land, which prioritises using brownfield first and then considers growth in settlements in terms of their relative sustainability linked to services and facilities. This approach is in line with government guidance and best practice. The release of Green Belt land should only be considered after all sustainably located, suitable, available and deliverable brownfield sites have been identified as allocations.
- Figure 4 sets out the 12 steps the Council have used to arrive at the current spatial strategy and allocations.
(2) Figure 4- Developing the Spatial Strategy

- The Draft Local Plan (2016) set out a clear spatial vision and strategy for the Borough, with an emphasis upon protecting and enhancing local character while fostering sustainable communities by concentrating new development on land within the Borough's transport corridors. Brentwood and Shenfield were the main focus for development in the A12 Corridor supported by two strategic allocations in the A127 Corridor, bringing forward new homes, businesses and employment opportunities.
- The focus for our updated spatial strategy is still clearly upon supporting transport corridor-led growth, with opportunities for brownfield redevelopment maximised wherever possible. In addition, we are introducing a limited level of growth in our larger villages to enhance the range and choice of local housing options but also to promote the retention and development of local services and community facilities. The strategy for higher-level strategic housing growth remains the same: create sustainable urban extensions and a new settlement at Dunton Hills.
- There is also a need to strike the right balance of location and scale of employment sites to ensure integrated strategies with housing and other land uses, support for sustainable travel modes and a portfolio of sites which meet the development needs of business and the wider economy for the 21st Century. The Plan has an overriding role to set the key strategic priorities for the area, including policies to deliver required jobs, allocation of key employment sites, and infrastructure to support the delivery of development. The Plan should aim to improve and build communities, not just be focused on the allocation of land. The NPPF is also clear that planning policies should avoid the long-term protection of sites allocated for employment use where there is no reasonable prospect of a site being used for that purpose.
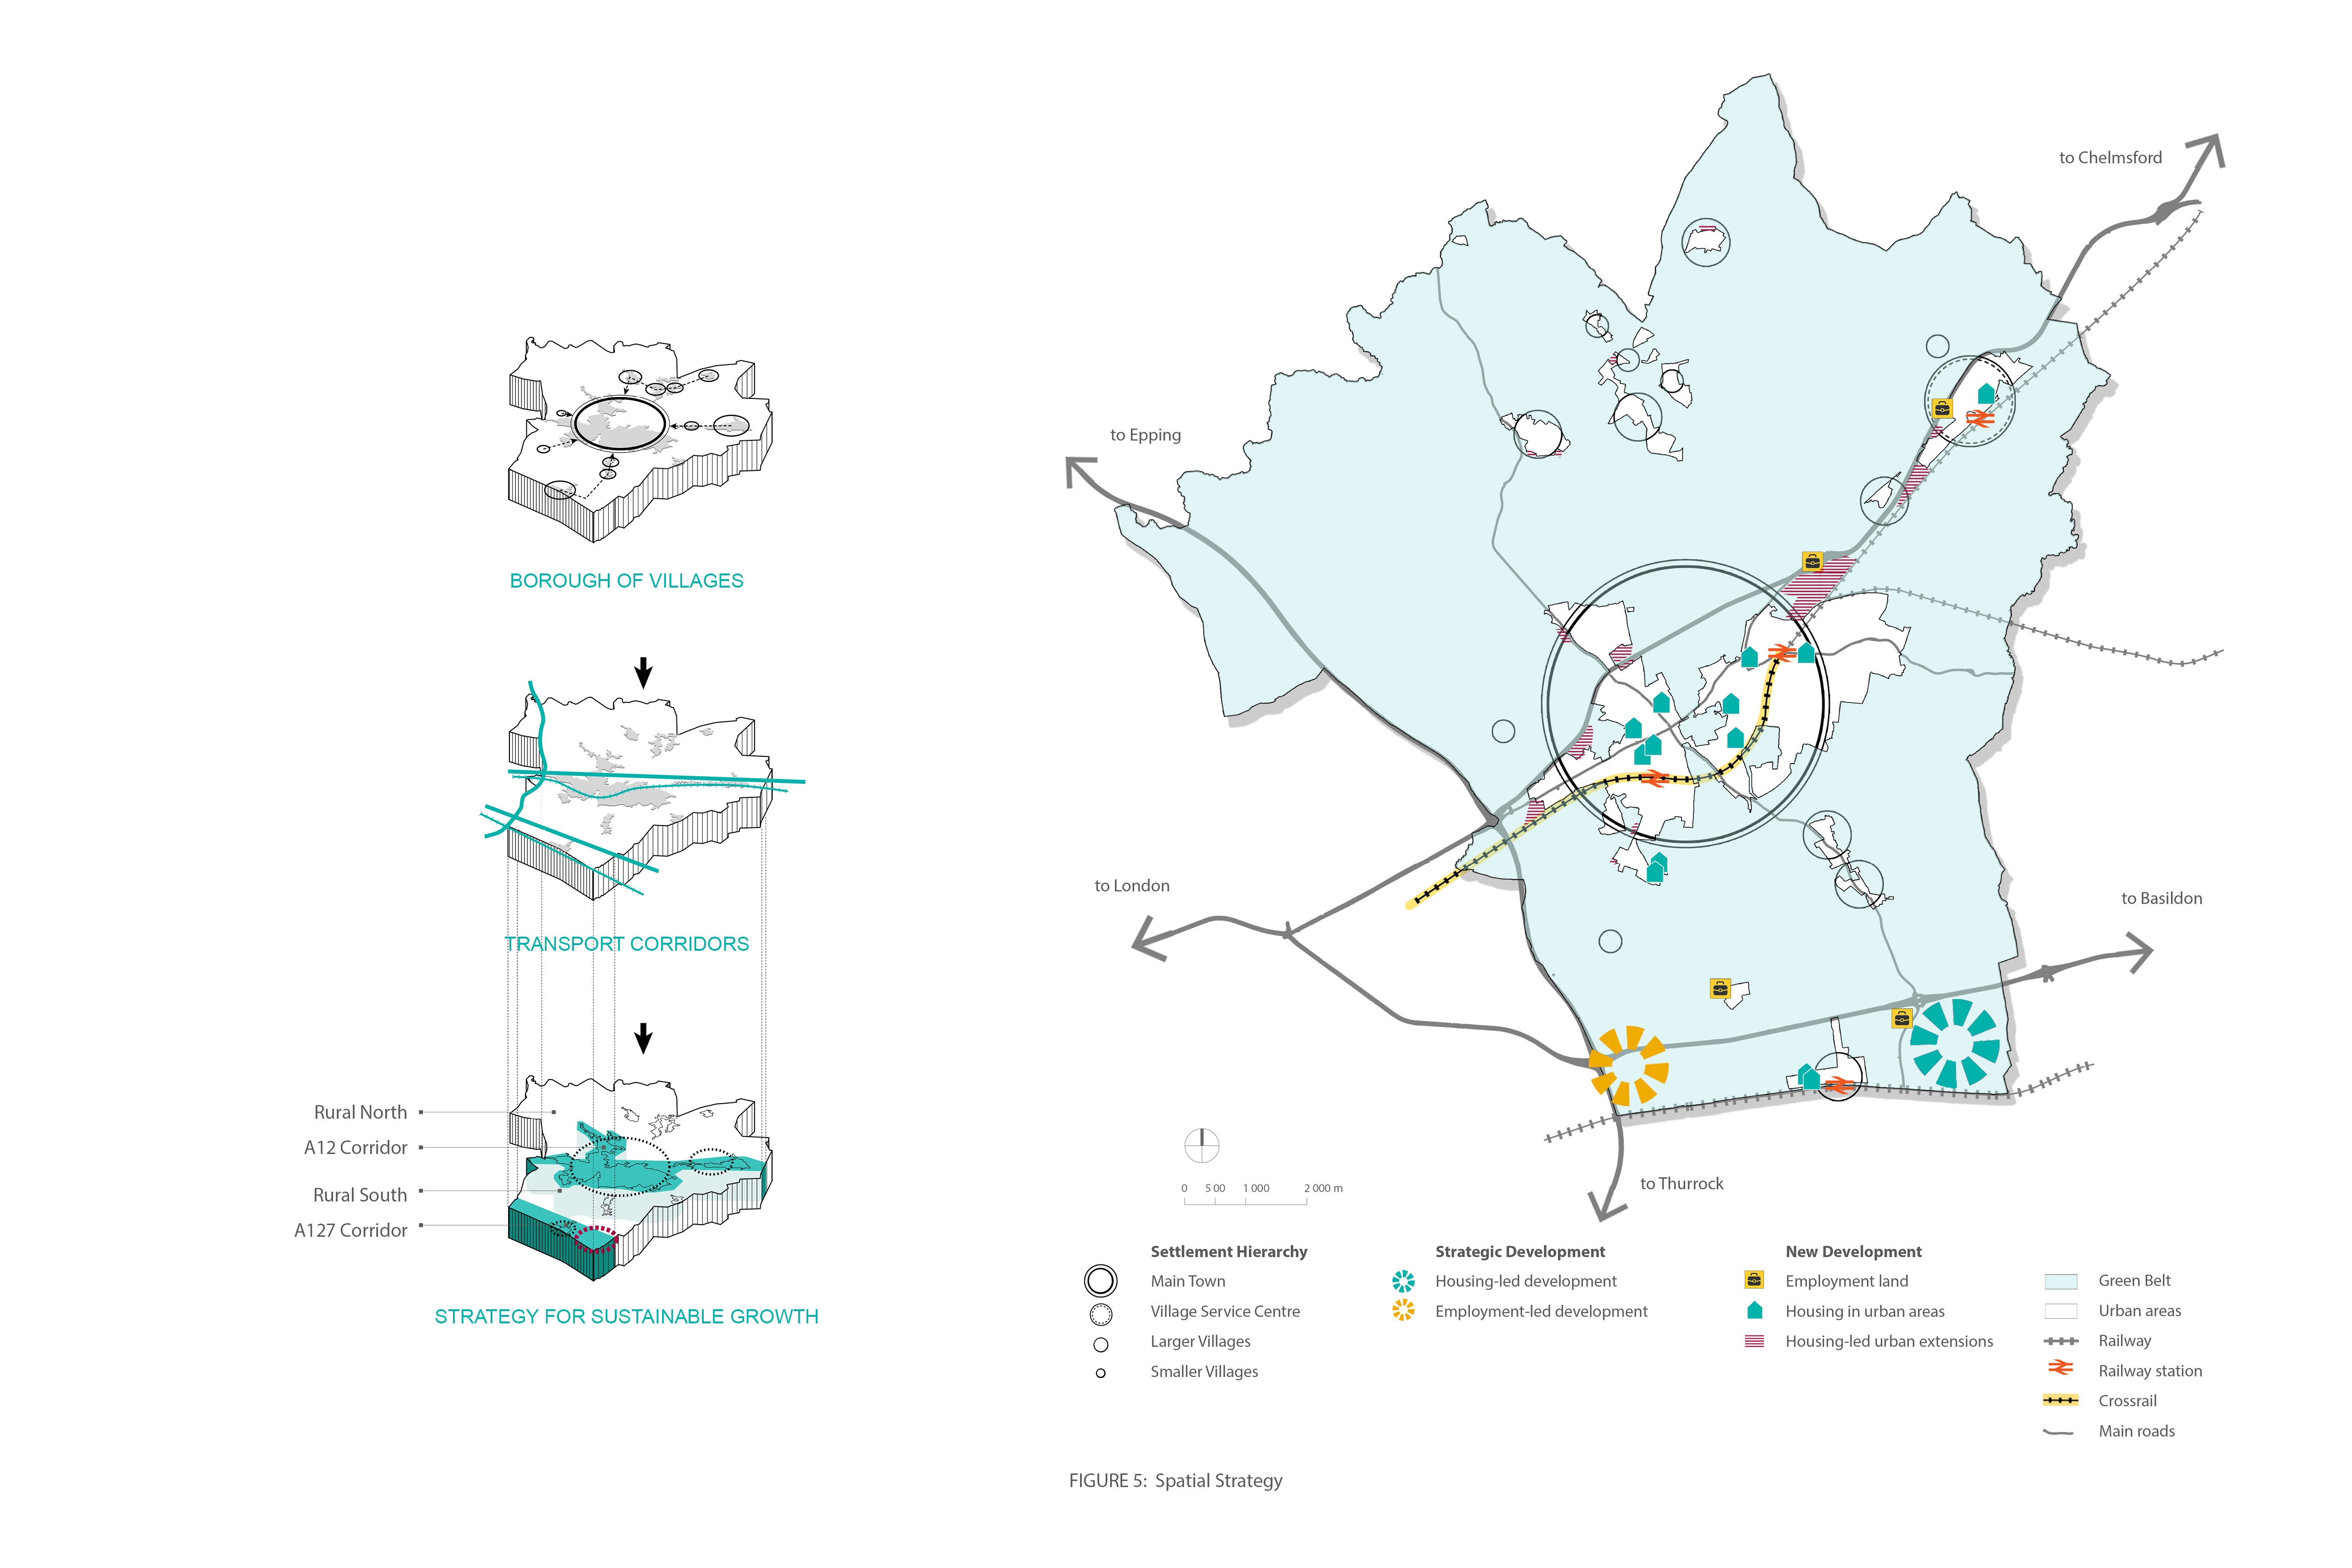
- Figure 5 sets out our updated spatial strategy, which builds upon the work detailed in the Draft Local Plan (2016).
(8) Figure 5 – Spatial Strategy
- We have also been continuing discussions with neighbouring authorities about the long-term future of the wider area. Work is progressing in South Essex with a commitment to joint working in order to secure infrastructure investment and consider wider growth opportunities. This partnership working will help ensure that the Brentwood Local Plan is robust, flexible and future-proof.
Housing and Specialist Accommodation – Need and Supply
(94) Housing Need
- Based upon the best available evidence at the time, the Draft Local Plan (2016) set out an objectively assessed housing need for the borough of 362 dwellings per annum, for the lifetime of the plan (2013-2033), which equaled 7,240 dwellings in total. The Strategic Housing Market Assessment (SHMA Part 1) (2015) and a subsequent report on affordable housing provision (SHMA Part 2) underpinned the Draft Local Plan (2016) position.
- Since the SHMA was drafted in late 2015, the Office for National Statistics (ONS) and Department for Communities and Local Government (DCLG) have released new data, which has been considered as part of assessing housing need as required by national policy and guidance. The key dataset releases included the 2014 based household projections and two rounds of Mid-Year Population Estimates (MYP) in 2015 and 2016. Comparing the 2012 and 2014 DCLG household projections reveals a slight uplift in households from 308 to 332, which converted to dwellings from the household data suggests an increase from 322 to 348 net new dwellings. This level of objectively assessed housing need remains lower than the 362 dwellings figure set out in the Draft Local Plan (2016).
- In line with Planning Practice Guidance, housing assessment studies should test official demographic projections to see if they seem a reasonable reflection of underlying trends. We have tested the housing assessment and conclude that the review of demographics and employment variables has not indicated a need to consider a higher level of housing above the updated demographic data level (348 dwellings). Indeed, the tests have indicated that the official short-term (5 year) forecast is particularly unstable and the longer-term demographic projections indicate a much lower demographic baseline figure for the borough – circa 280 dwellings per annum.
- However, importantly due to the worsening of the affordability ratio in Brentwood and the increased costs of rental levels, conclusions identify the need for a reasonable upwards market signal adjustment. Compared to most of Essex, the borough is much less affordable, homes are more expensive, and now less affordable than the last housing boom. The degree of market signal uplift is a matter of professional judgment and evidence indicates a 30% uplift above the new 280 dwellings per annum baseline, plus a small contingency of 6% should new official projections indicate a slightly different position to that forecasted.
- In summary, using the minimum revised net dwelling baseline figure (280) plus combined market signal adjustment and contingency adjustment of 36%, this leaves an objectively assessed housing need of circa 380 dwellings per annum or 7,600 dwellings across the plan period (2013-33). The revised housing need from 362 per annum to 380 per annum across the plan period (20 years) equates to a total dwelling increase of 360 additional units.'. The updated SHMA is published as part of this consultation.
- The Department for Communities and Local Government has recently consulted on the methodology for a standardised approach to calculating local housing need in England. The Council responded to this consultation outlining concerns over the proposed methodology and datasets which would see an increase in Brentwood's housing need to 454 dwellings per annum. This would be an additional 74 dwellings per year. For the purposes of plan-making and allocations it is considered prudent at this stage to plan for housing numbers slightly above the 380 dwellings per annum figure to create some degree of flexibility and contingency should some housing sites fail to come forward as expected.
- 380 dwellings per annum is a challenging growth rate for the Borough. Historically, through the early part of the plan period (2013 to 2017), the borough has obtained an average housing completion rate of circa 132 dwellings per annum. This means almost tripling our annual delivery rate of new homes. The accompanying Sustainability Appraisal includes a higher growth scenario to identify potential implications, which are discussed within the site assessment section below.
- It is important that we rise to the challenge of delivering substantially more new homes than in recent years and that these be in sustainable locations. Not only will this support our current and future residents, housebuilding can have a strong positive impact on our local economy. Investment in housing delivers jobs[6], supports construction businesses and their supply chain; provides new affordable homes and infrastructure (such as school investment), increases tax payments to be spent on local services, and if managed effectively improves ecology, landscaping and open space provision and other facilities. With new residents comes new expenditure on local shops and services, creating a positive multiplier impact on the local economy.
(17) Specialist Accommodation Needs
- Objectively assessed housing need for the Borough does not take into consideration specialist accommodation need linked to residential care homes or nursing homes (classified as C2 – 'residential institutions' under the Use Classes Order), and Gypsy & Traveller pitches and accommodation provision. The published SHMA Part 2 identifies a forecast requirement for 424 spaces within Registered Care to be provided between 2013-2033 (21.2 spaces per annum). This is housing for people living in registered care homes which are managed and run by a care provider who is responsible for all aspects of their daily needs and wellbeing. Such housing is not self-contained and is often referred to as either residential or nursing care. The Borough has a slightly higher proportion of over 65s compared to the county average and this is forecasted to increase from 2015 to 2025 by about 17%.[7]
- A Gypsy and Traveller Accommodation Assessment (GTAA) has recently been prepared by specialist consultants. The Brentwood GTAA (2017) forms part of a wider study that covers the whole of Essex. The study identifies those Gypsies, Travellers and Travelling Showpeople which should be planned for in accordance with the Government's Planning Policy for Traveller Sites Statement (PPTS), as they meet the 2015 planning definition of 'travelling' households, and those which should otherwise have their specific cultural needs of living accommodation met in accordance with the Equalities Act 2014, the Children's and Families act 2014 and the Human Rights Act 1998, but do not meet the 2015 planning definition of 'travelling' households and are referred to as 'non-travelling'. A survey was undertaken as part of the work where a number of 'unknowns' ([8]) were also identified.
- Brentwood has a reasonably modest Gypsy and Traveller need requirement for the period 2016-2033, calculated to be:
-
- Gypsy and Travellers which meet the planning definition (PPTS) (+10% of unknown need) = 12 pitches; and
- Gypsy and Travellers not meeting the planning definition (+90% of unknown need) = 66 pitches.
- There are currently no transit sites in the Borough although the GTAA (2017) recommends the Council engage, through the Duty to Cooperate, with other Essex authorities to establish whether there is a need for investment in more formal transit sites or emergency stopping places. A review of the evidence base is advised relating to unauthorised encampments once there is a three-year evidence base following the changes to PPTS in 2015. The GTAA (2017) finds no evidence of need for Travelling Showpeople accommodation within the Borough.
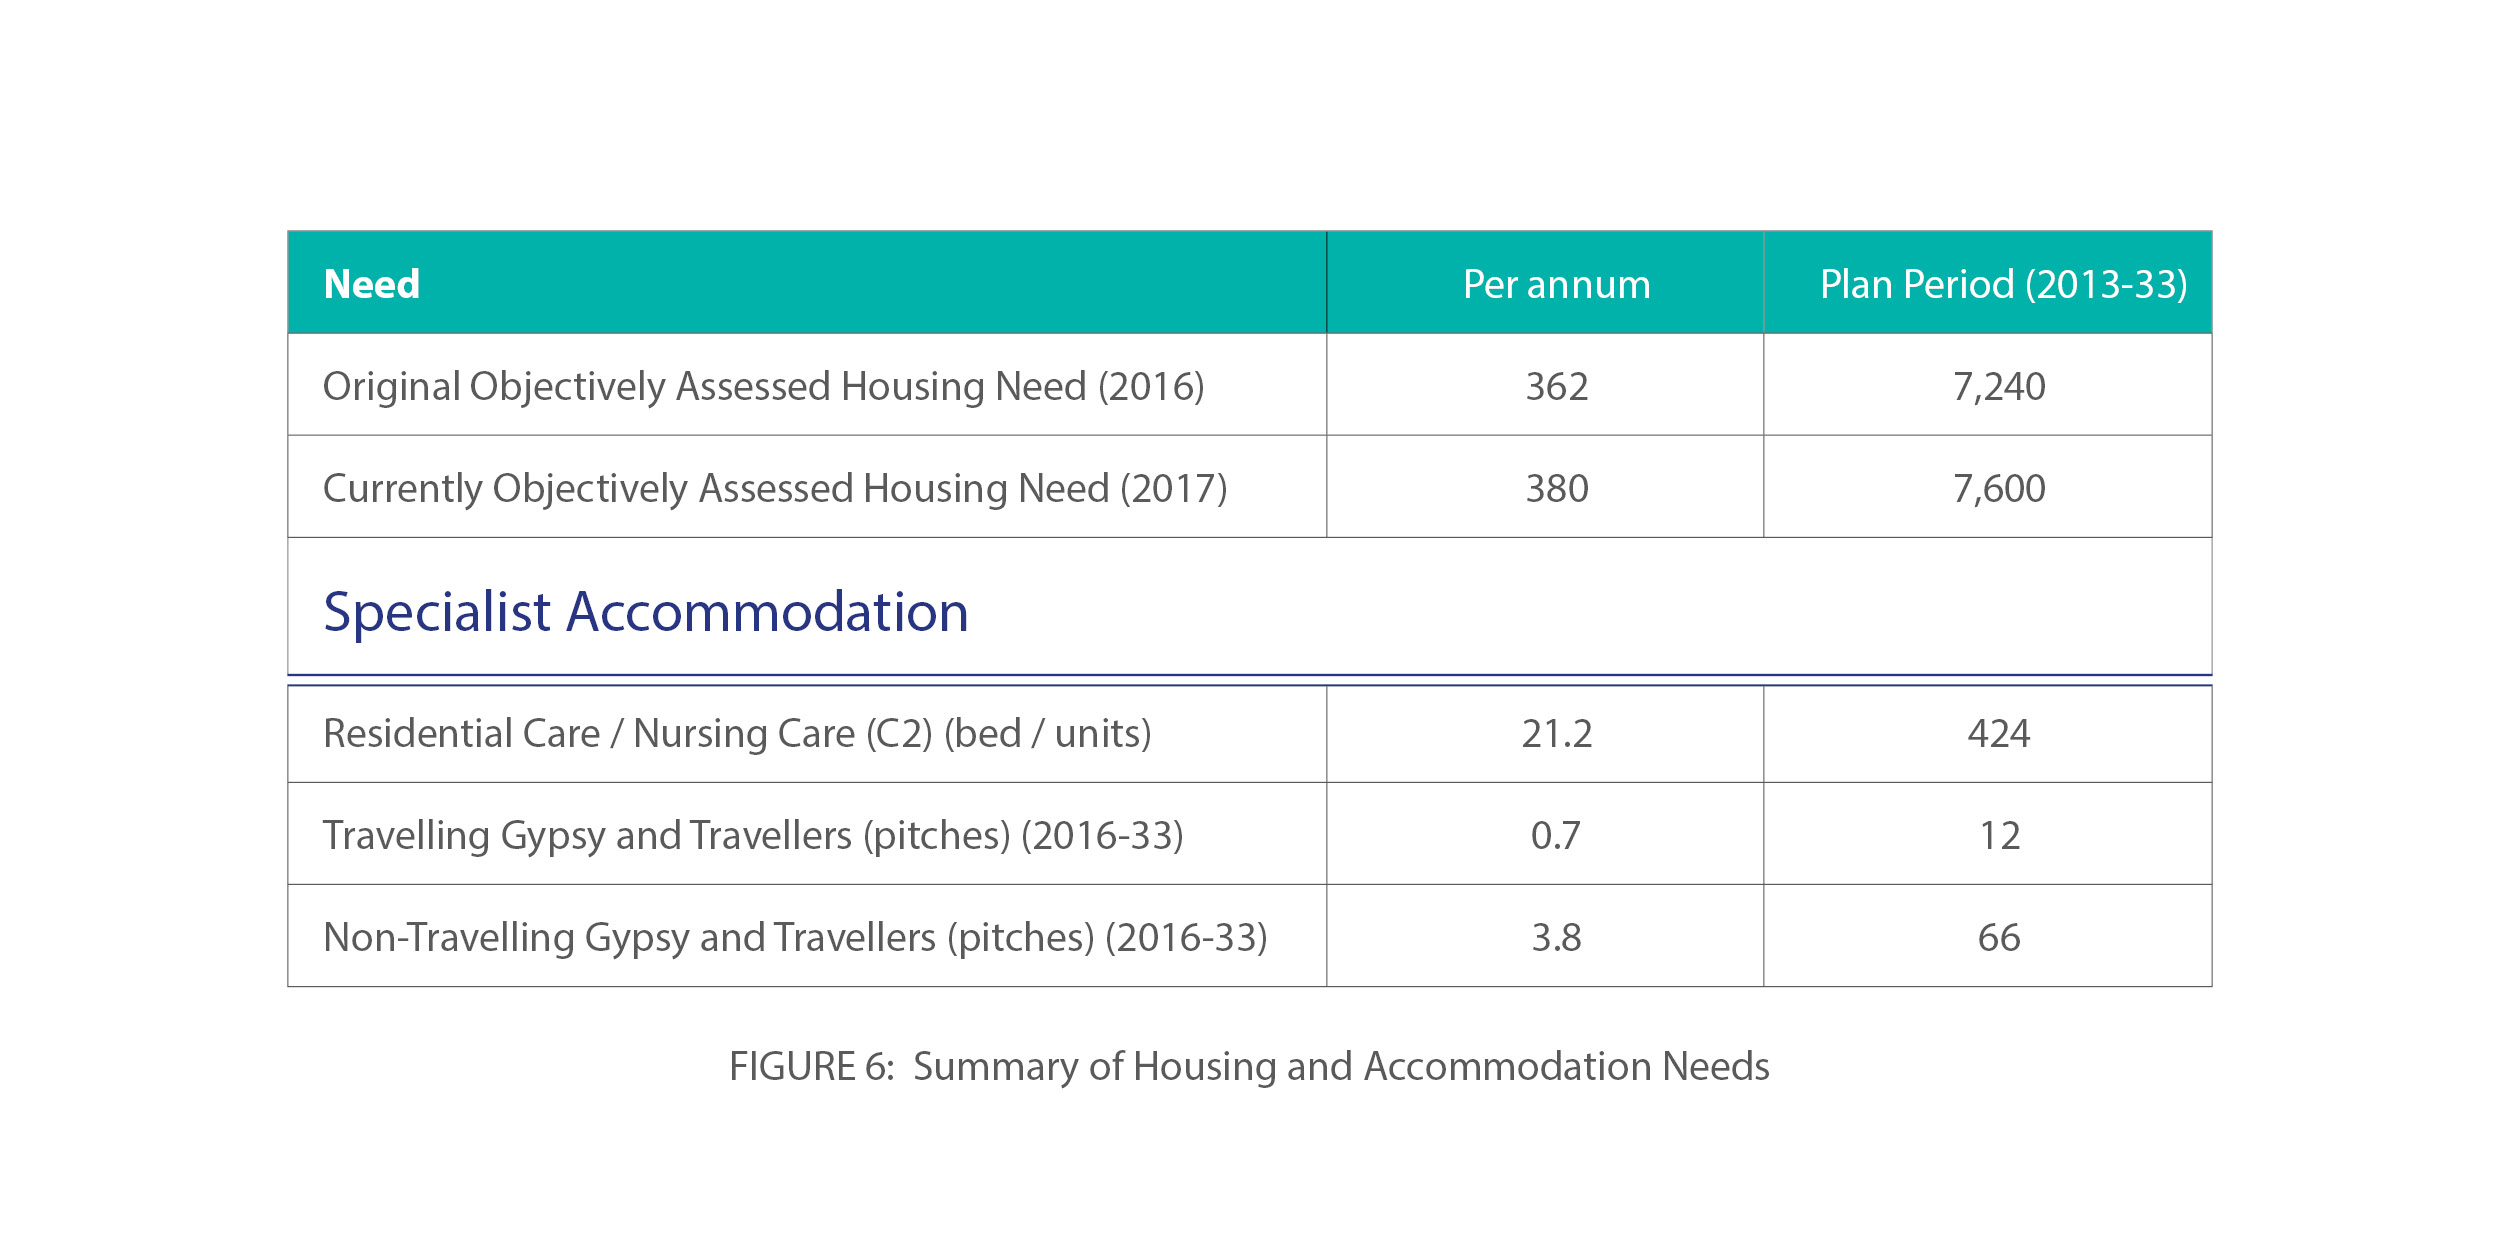
- Figure 6 summarises the borough's current housing and accommodation needs.
Figure 6 – Summary of Housing and Accommodation Needs
(35) Housing Supply
- Updated work on objectively assessed housing need has indicated an annual baseline of 380 dwellings per annum, which equates to 7,600 dwellings across the plan period (2013-33). This is a total increase of 360 units from Draft Local Plan baseline in 2016. The increase in need is driven primarily by the upwards market signal adjustment to address local housing affordability issues.
- While work has been progressing on establishing an updated housing and accommodation need position, attention has also been given to reviewing the delivery capacity of previously proposed housing sites in the Draft Local Plan (2016). This has included fine tuning and revising net delivery rates, developable areas and density calculations, as well as updating the planning status of each site. Work was also commissioned on producing a Brentwood Town Centre Design Plan (2017) and site viability work which has informed potential site yields.
- The National Planning Policy Framework (NPPF), is clear in the need for local plans to be supported by a robust set of evidence on deliverable (within the first 5 years of the plan) and developable (years 6 to 10 of the plan) housing sites.[9]
- With the increase in housing requirements and a decrease in yield from the previously considered proposed allocations (reduction by about 413 dwellings), this has left a need to consider a wider range of housing site options. The Council undertook a 'call for sites' in early 2017 and a full update to the current Strategic Housing Land Availability Assessment (SHLAA) (now integrating employment sites and called a 'Housing and Employment Land Availability Assessment' – HELAA), is well progressed with a summary of the key HELAA findings included with this consultation.
- The Council received a number of representations on the Draft Local Plan (2016) suggesting that there was a lack of information about the site assessment methodology and overall process. A summary of the site assessment process undertaken is detailed in Figure 7, with a detailed site assessment methodology technical note available alongside this consultation. This work is based upon best practice and is considered to provide a robust framework for site assessment and selection.
(10) Figure 7 – Site Assessment Process

- This detailed site selection has been based upon the spatial strategy and a sequential approach to selecting sites for development. This approach attempts to maximise brownfield redevelopment opportunities and support growth within sustainable locations.
(8) Summary of Proposed Housing-Led Allocations
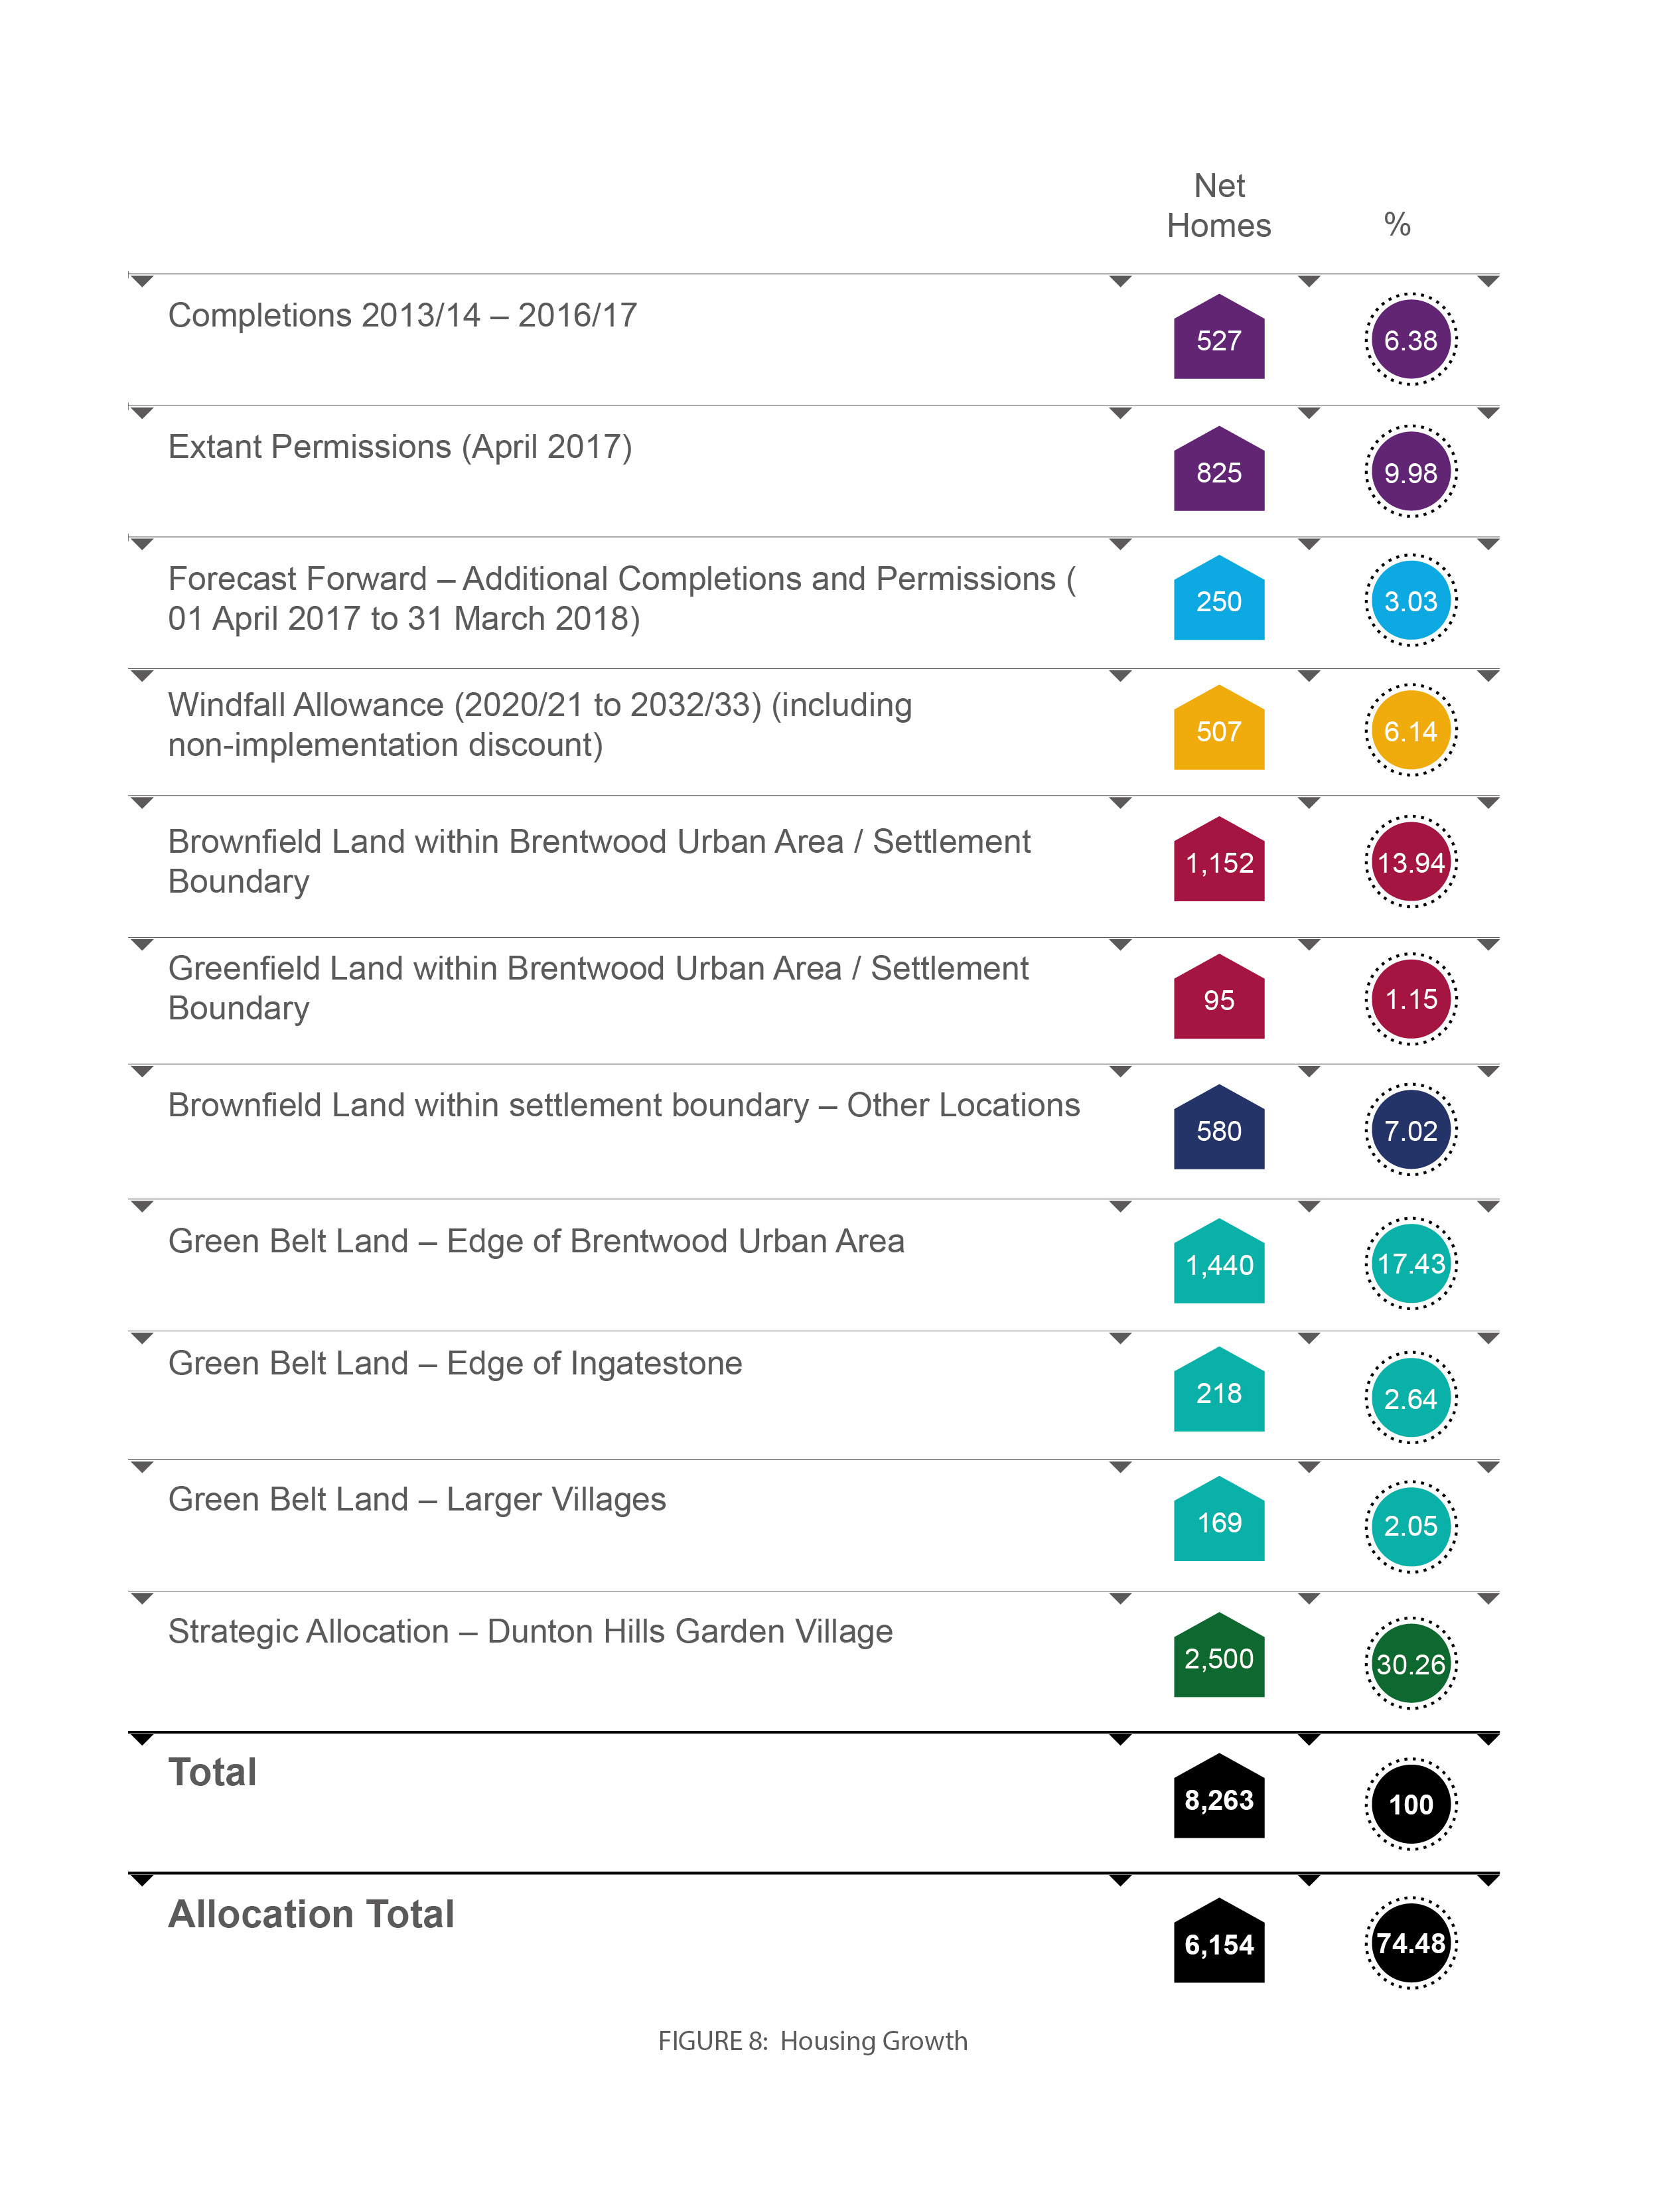
- Figure 6 above sets out a summary of the overall housing and specialist accommodation need across the plan period (2013-33), which totals 7,600 dwellings. Figure 8 below sets out how the housing need is proposed to be met across the Borough, updating the table under Policy 5.2 of the Draft Local Plan (2016). Approximately 25% of the housing need for the plan period has already been met through completions, permissions, windfall and forecast forward completions/permissions to 31March 2018.
- Figure 8 also indicates that about 22% of the forecast housing growth will take place within existing settlement boundaries and on primarily brownfield land. A similar percentage of forecast growth is being considered for non-strategic sites within the Green Belt and the Dunton Hills Garden Village strategic allocation accounts for just over 30% of the identified housing growth within the plan period. The housing allocations proposed within this publication amount to 6,151 dwellings, or just over 74% of the total housing growth.
(8) Figure 8 – Housing Growth
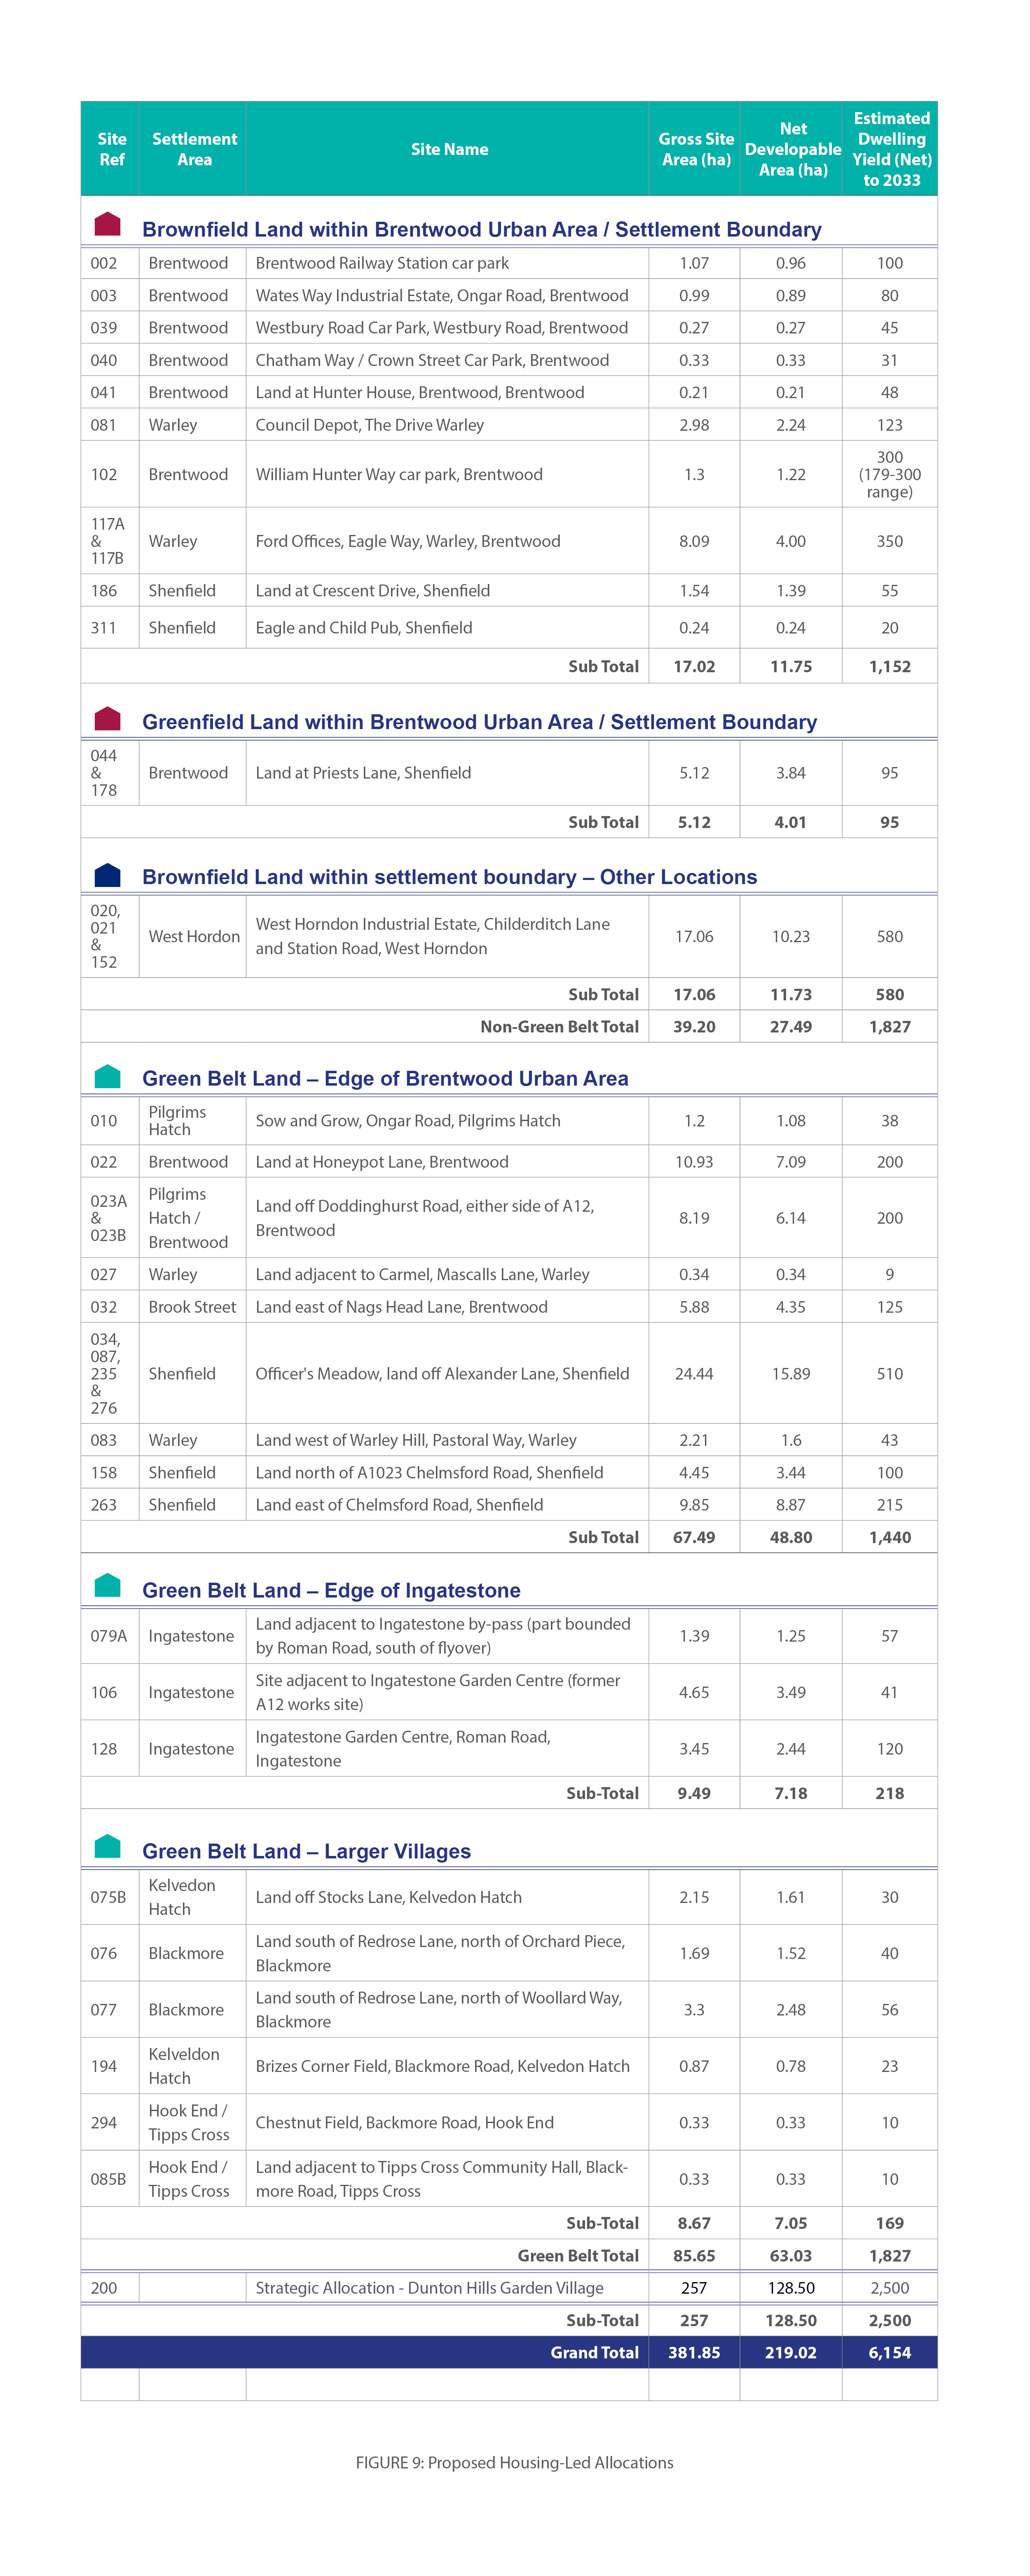
- The sites proposed for allocation are detailed in Figure 9. These follow the sequential approach to site selection detailed previously utilising the borough's current settlement hierarchy.
(22) Figure 9 – Proposed Housing-Led Allocations
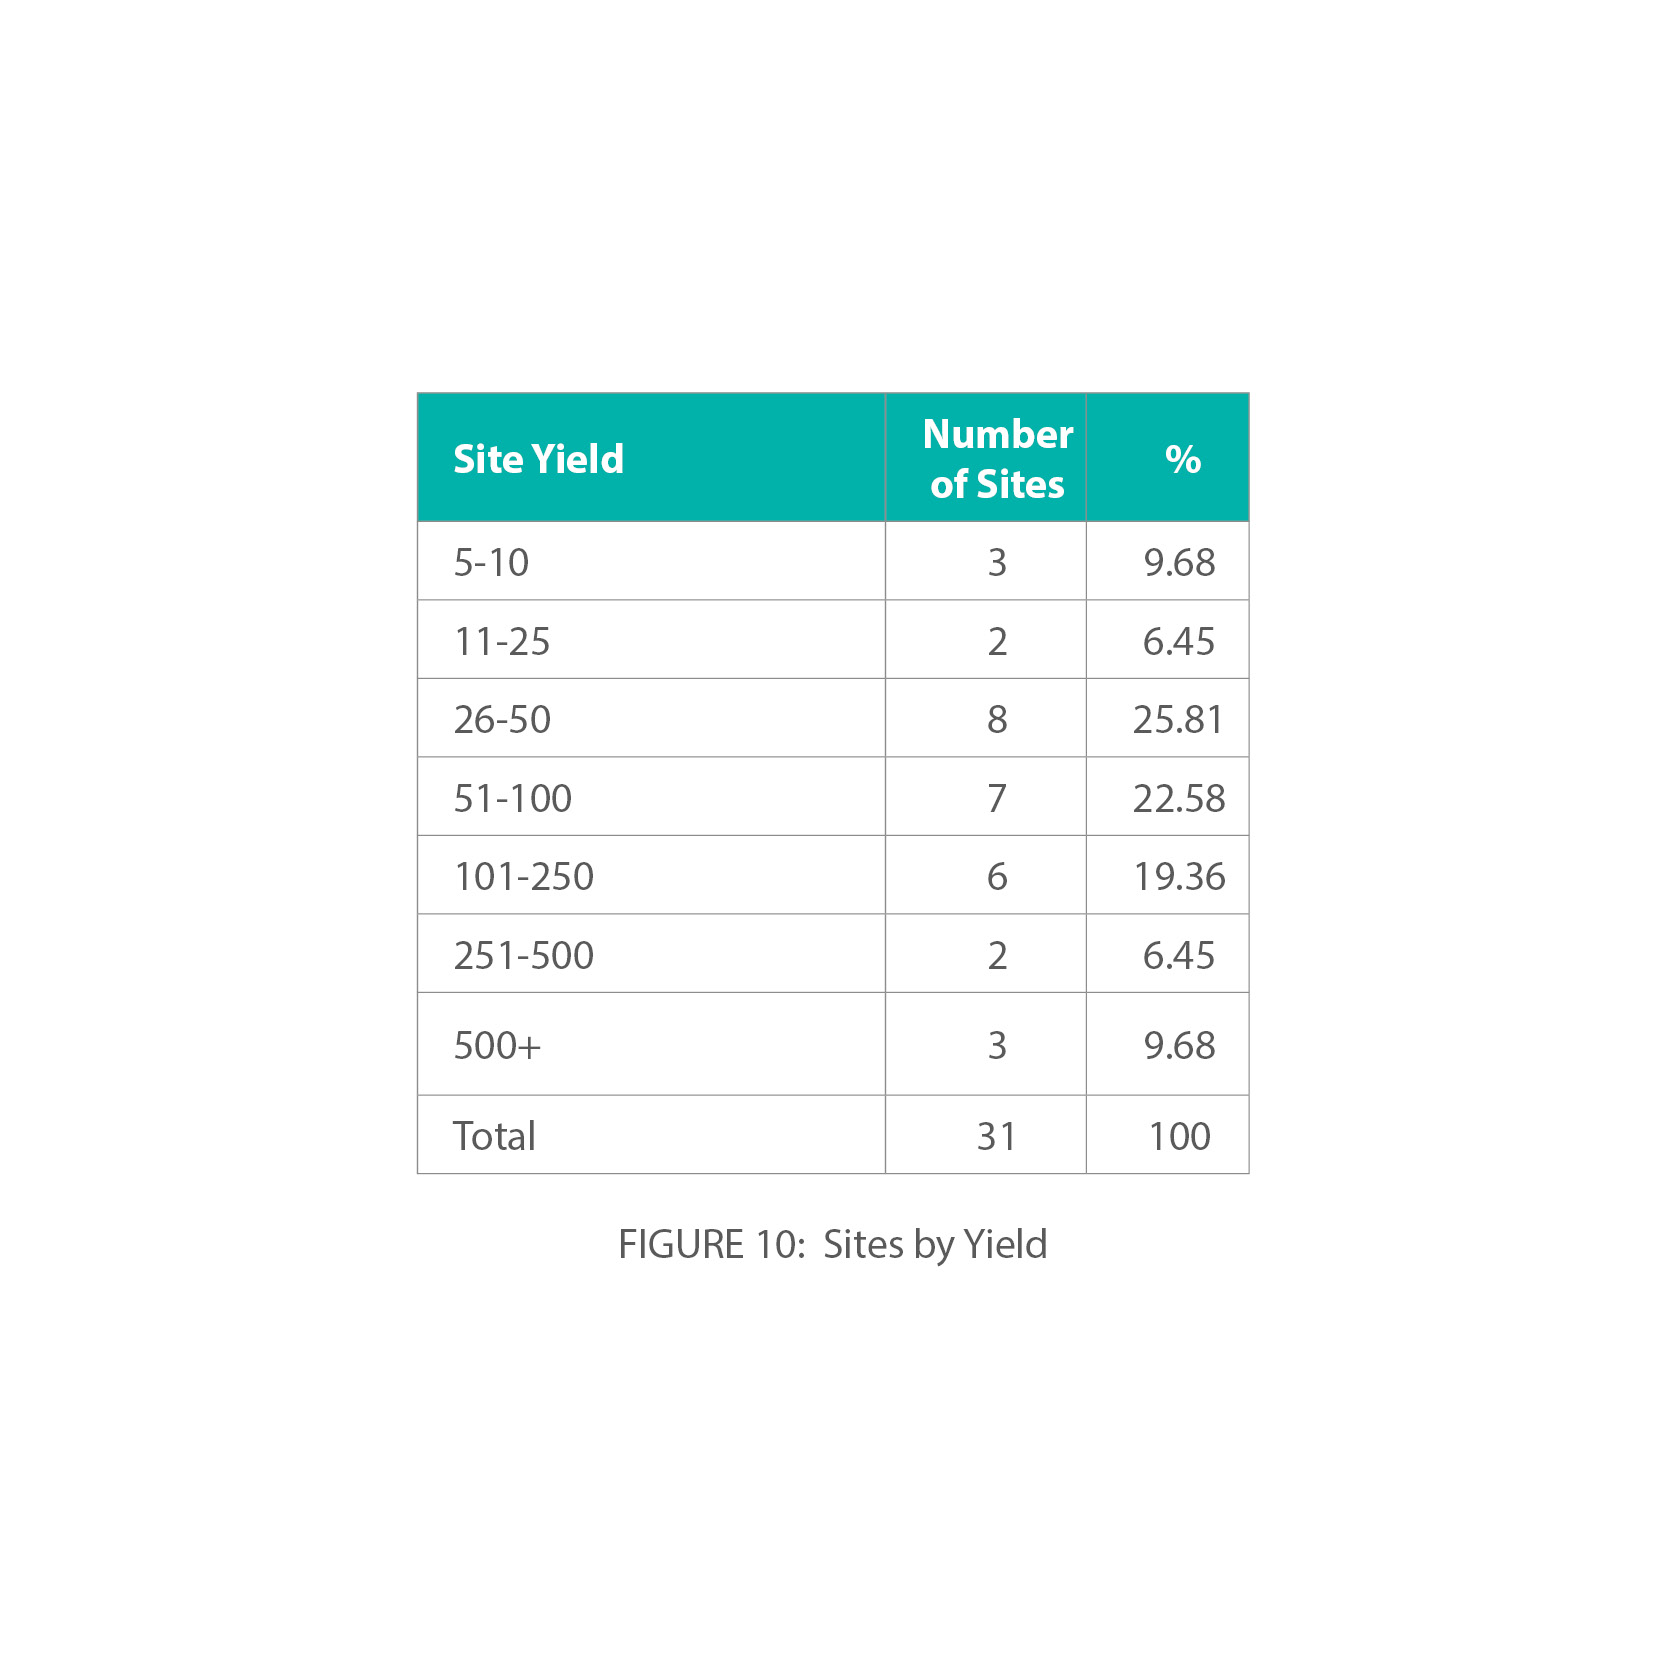
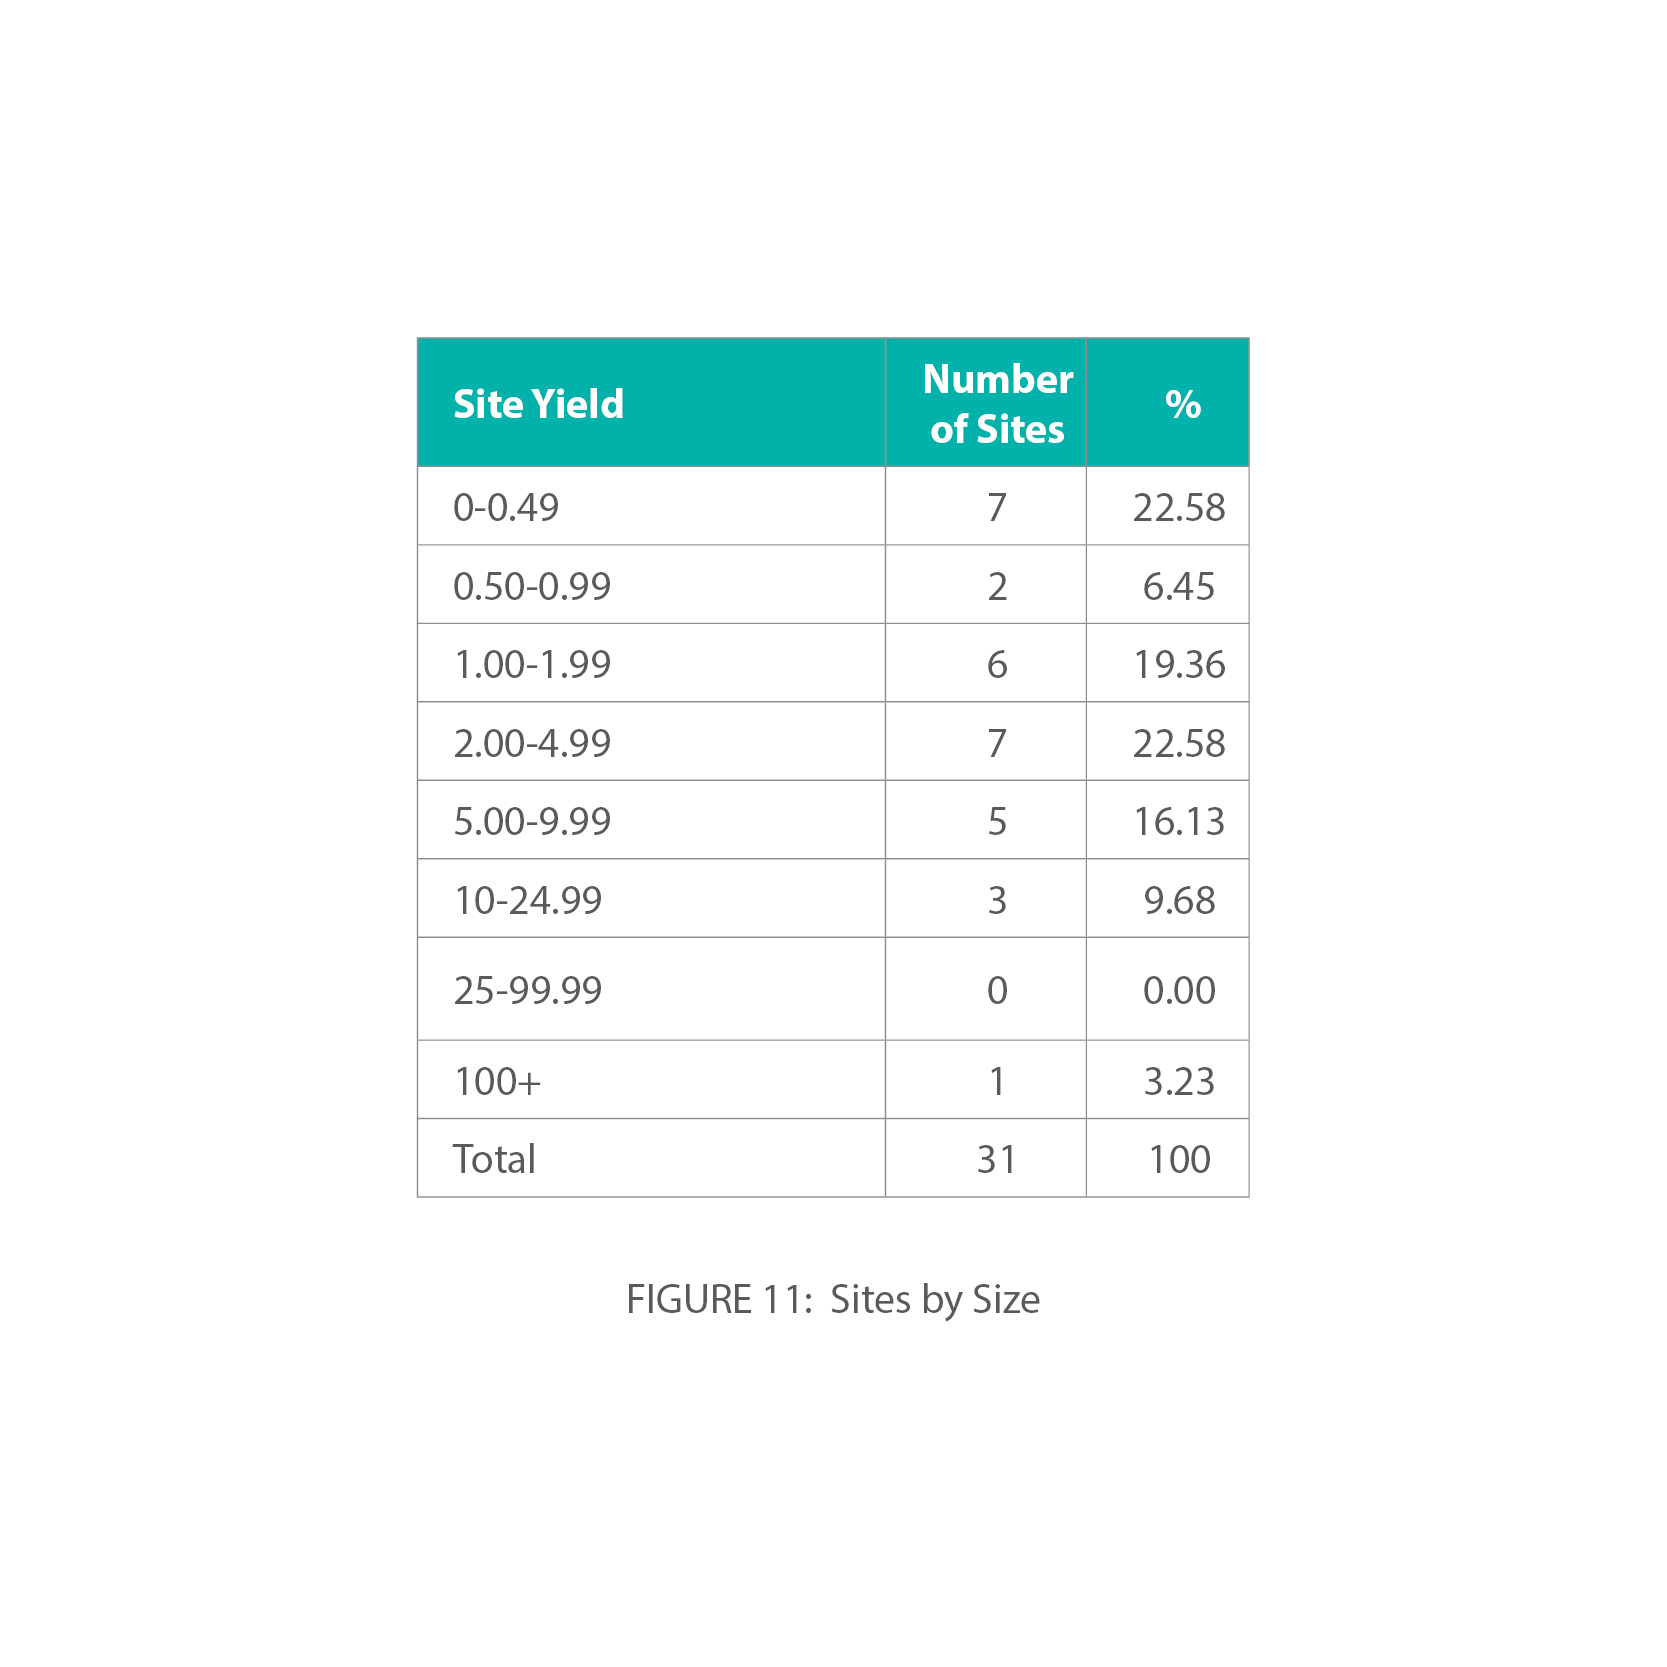
- In total there are 31 housing-led allocations proposed. Figure 10 groups the sites by yield showing that about 42% of the sites are forecast to yield dwellings of between 5-50 units (small sites), with 42% of sites yielding dwellings of between 51-250 units (medium sized sites), and about 16% of the site portfolio delivering units in excess of 251 units (large and very large sites). Figure 11 also groups the sites by gross size.
(3) Figure 11 – Sites by Size
- The Government is clear that planning policies should allow for a good mix of housing sites to come forward so that there is sufficient consumer choice, support for sustainable growth and importantly opportunities to diversify the construction sector. To support small business and diversification in the housing sector, Government has indicated through the Housing White Paper that it may set a requirement for at least 10% of sites allocated for residential development in local plans to be half a hectare or less.[10]
- The mixed portfolio of proposed housing sites provides a range of new homes from urban high density flatted developments through to traditional small and medium-sized estates to new urban extensions and a large scale new garden village settlement. Rarely has the borough witnessed such a range and mix of opportunities to create new communities and high quality places.
- Work on the Brentwood Town Centre Design Plan (2017) has established a series of realistic potential site yields and initial directions on layouts for brownfield sites, including, Westbury Road car park and Chatham Way / Crown Street car park. Building upon the content of the Design Plan, William Hunter Way car park has undergone further detailed analysis to ensure that potential options for the site are financially viable and maximise development potential (including mixed uses), which is published with this consultation document. Site capacity is identified for 300 dwellings at William Hunter Way, which reflects the desire to also deliver viable commercial (retail/leisure) uses and accompanying car parking. This number could be reduced, but may affect the potential for mixed-use development if so. Further work is ongoing to identify the best way to enable redevelopment to benefit the whole Town Centre.
- Wherever possible the Council is keen to see an integrated and comprehensive approach to development – particularly where preferred allocation sites are within close proximity. Work is progressing on:
-
- Creating a spatial framework and key masterplanning concepts for land in Warley – connecting the Ford site and the Council Depot area;
- Ensuring development on land at Officer's Meadow and surrounds is developed through a comprehensive co-ordinated masterplan;
- Establishing a set of key design and masterplan principles for the redevelopment of the West Horndon industrial estate sites;
- Providing further design, layout and land use direction for the sites at Priests Lane and Honeypot Lane, and
- Developing a comprehensive masterplan for the new garden village at Dunton Hills, to engrain the core garden village design principles.
- It is intended that the final outcomes of the urban design and masterplanning work will inform the final submission draft local plan.
- The proposed housing allocations for the more sustainable villages are limited in size and scale but will at a local level provide a valuable role in enhancing the housing mix, introducing new affordable housing and help support local shops and services. As smaller greenfield sites they are likely to be attractive to smaller builders and have the possibility of being built out relatively quickly to support housing delivery within the early stages of the Plan being adopted. As with all current Green Belt sites, the Council is keen to ensure that edges of the sites are defendable and the revised village envelopes will be retained for the lifespan of the local plan and beyond.
- The Government's proposed standardised objectively assessed housing needs methodology indicates a need for Brentwood to deliver a capped figure of 454 dwellings per annum. Assuming that this figure applies from the beginning of the plan period this would total 9,080 dwellings across the plan period (2013-2033), or an extra 1,480 dwellings. Should the Council need to accommodate this significant increase in housing need, consideration is being given as to whether the delivery of Dunton Hills Garden Village could be accelerated to increase its dwelling yield within the plan period. Dunton Hills has capacity to deliver 2,500 dwellings within the plan period, but has a possible total dwelling yield in excess of 3,500 dwellings. This is at least another 1,000 dwellings beyond the end of the plan period to 2033. This work is linked to site masterplanning, consideration of various modern methods of construction, early upfront infrastructure delivery and a clear delivery plan with comprehensive site phasing.
- Further information and a full listing of the proposed housing-led allocations are detailed in Part 2 to this consultation document.
(8) Land Supply for Meeting Specialist Accommodation
- As noted previously, the published SHMA Part 2 identifies a forecast requirement for 424 spaces (excluding current planning applications) within Registered Care to be provided between 2013-2033 (21.2 spaces per year). The submission draft version of the new local plan will include a new monitoring section with a trajectory and accommodation indicators including C2 spaces.
- Figure 12 sets of the current location and type of housing for senior citizens, which covers a wide range of housing and residential types. It can be noted from Figure 12 that there is a particular concentration of senior citizen housing around the Brentwood Urban area and more limited facilities within lesser populated and less accessible areas.
(3) Figure 12 – Senior Citizen Housing in the Brentwood Borough

- The Council would expect that the majority of future provision of C2 facilities be located within larger sites with good access to services and facilities and to external spaces including greenspace. Brentwood Town Centre and the main urban areas may also provide some more limited opportunities for accommodating C2 facilities – possibly through the regeneration of brownfield sites.
- Potential larger site options for integrating new C2 facilities may include:
-
- Dunton Hills Garden Village (two large homes – 204 beds in total);
- West Horndon industrial estates redevelopment (small to medium - 60 bed scheme);
- Officer's Meadow and surrounds (small to medium – 60 bed scheme);
- Honeypot Lane / Priests Lane (small to medium – 40 bed scheme);
- Ford / Council Depot, Warley (small to medium – 60 bed scheme)
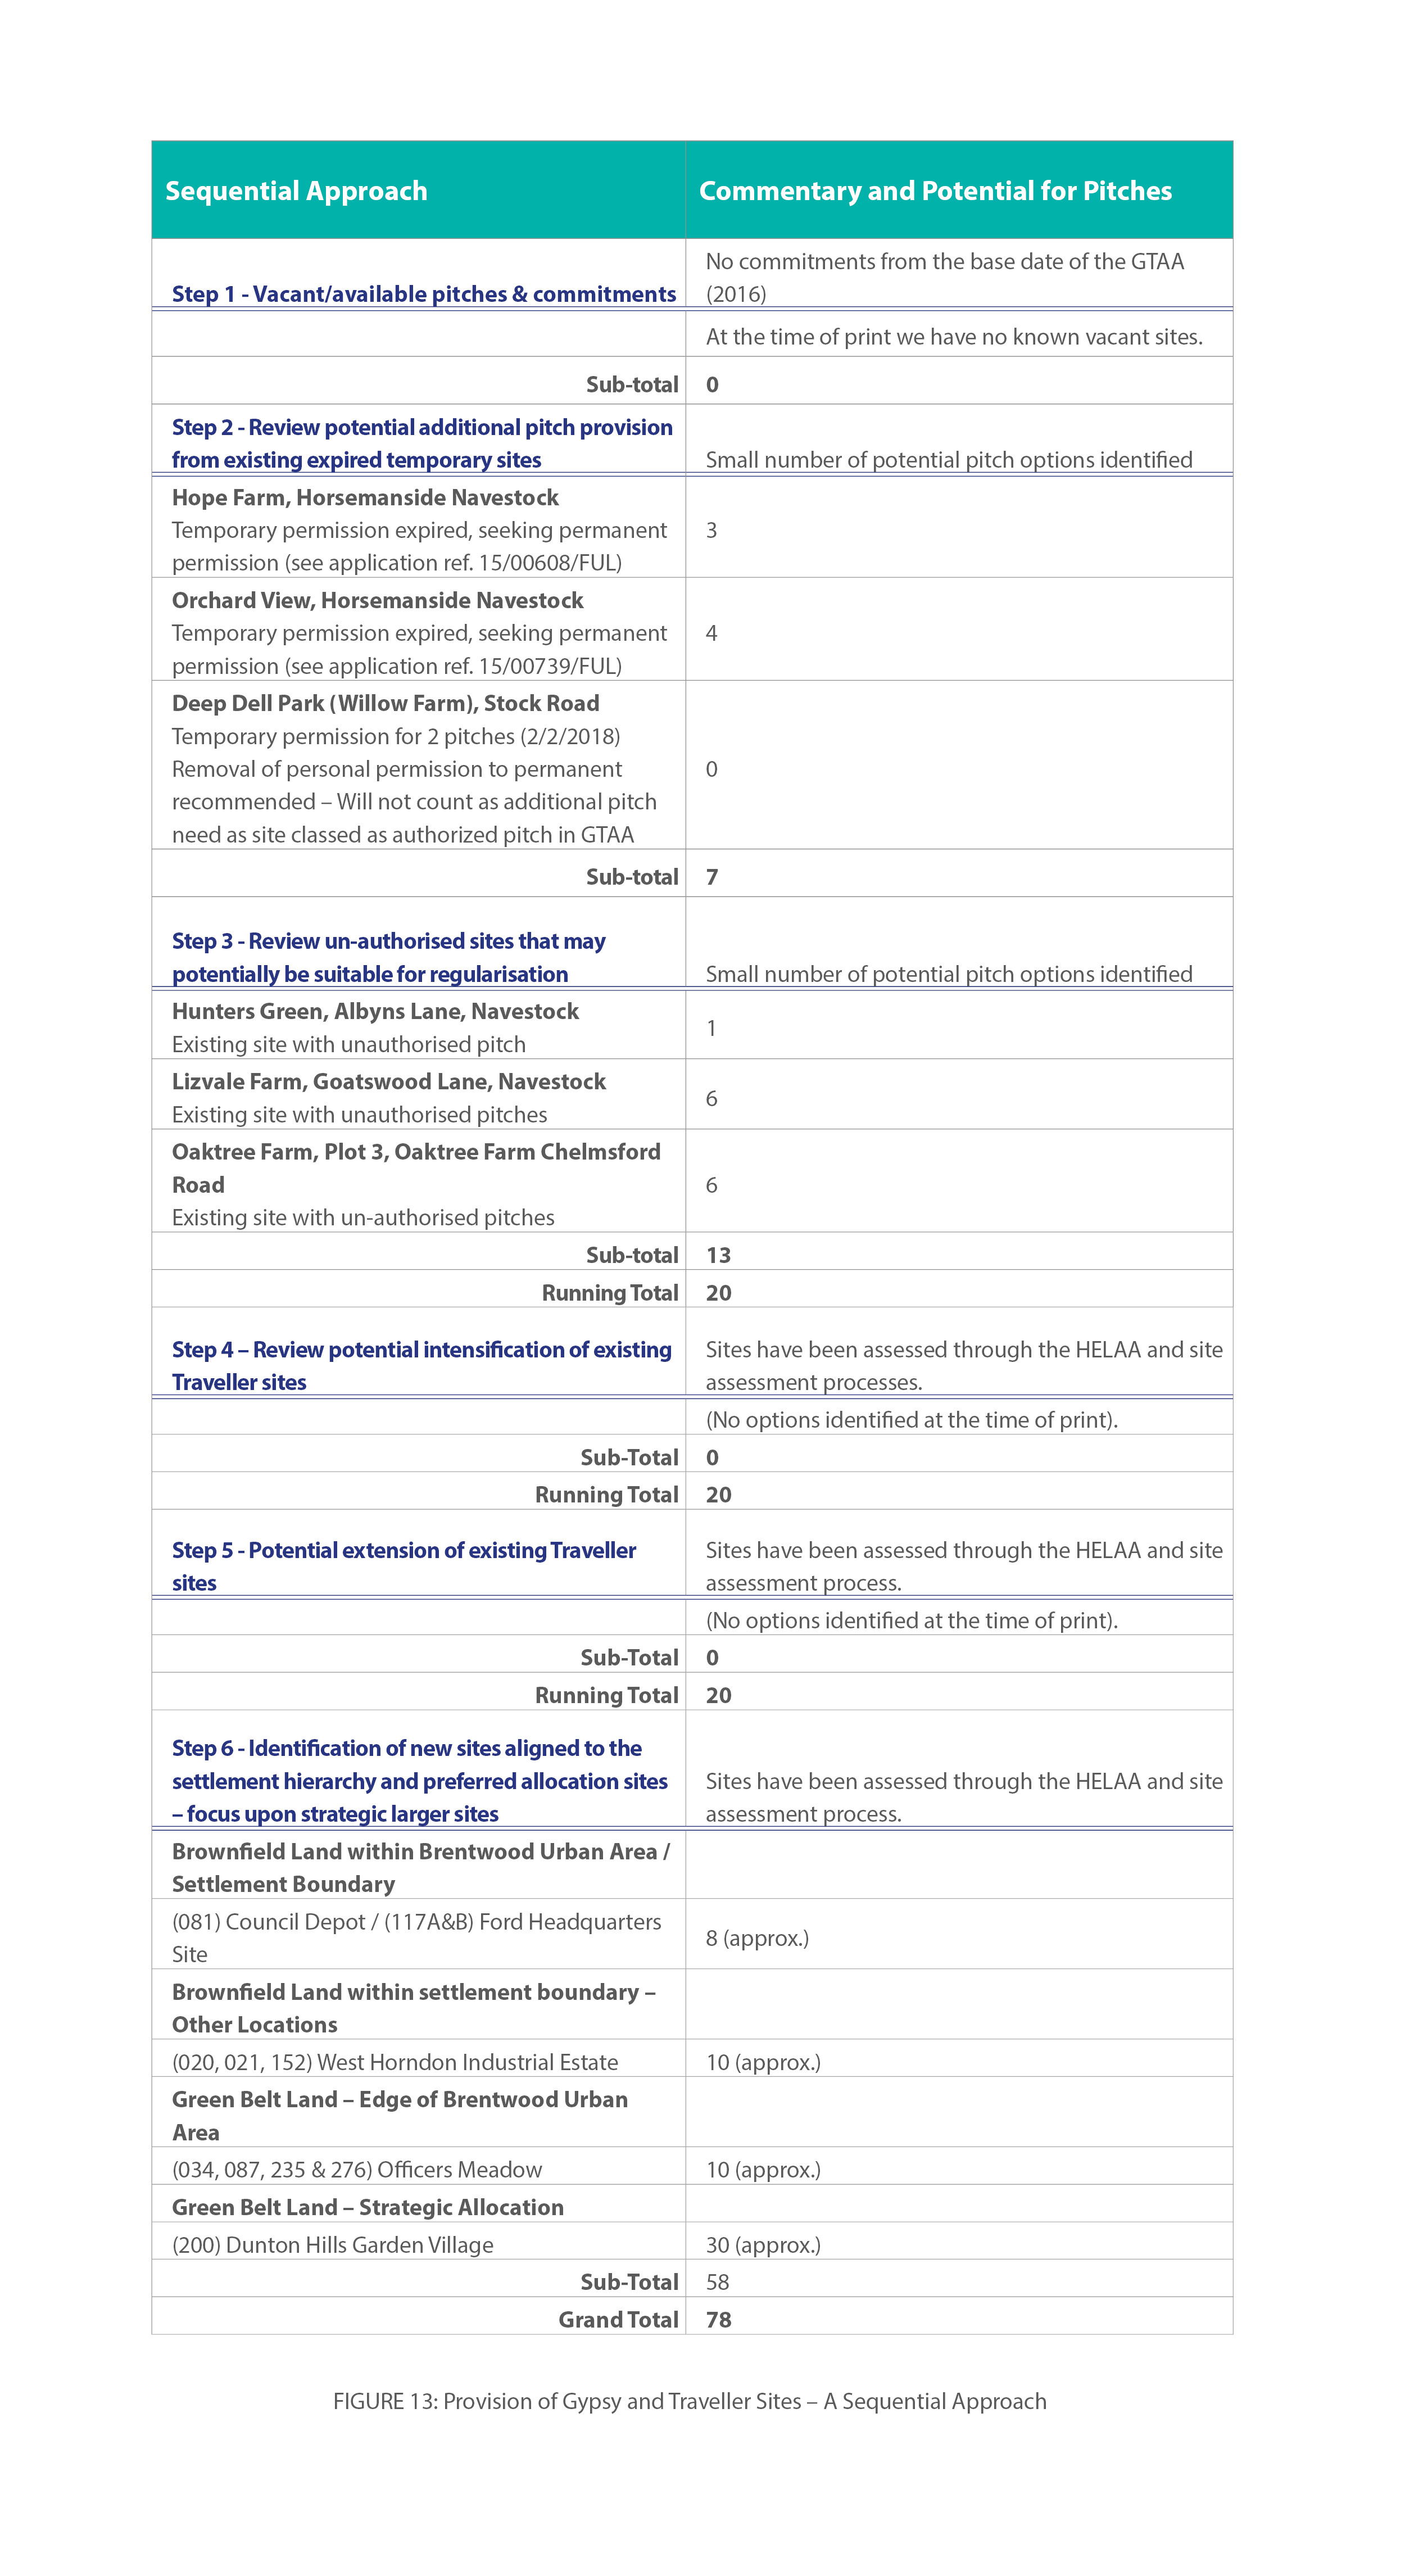
- From the analysis detailed previously we have a total need within the borough for 78 pitches across the plan period to meet the need of travelling Gypsy and Travellers (12 pitches) and Gypsy and Travellers who do not meet the planning definition but who still require access to more specialist accommodation or pitches (66 pitches). For the identification of sites and pitches for both Travelling and non-Travelling Gypsy and Travellers, we have adopted a sequential approach to site identification, based upon best practice. Figure 13 outlines the sequential approach. Authorised pitches counted in the GTAA include sites with planning permission in the form of permanent, personal or temporary. Therefore, the allocation of any Gypsy and Traveller site with either a live temporary planning permission or a personal occupancy condition cannot be counted towards the borough's identified need.
(23) Figure 13: Provision of Gypsy and Traveller Sites – A Sequential Approach
- Government policy states that Traveller sites (temporary or permanent) in the Green Belt are inappropriate development, which by definition is harmful to the Green Belt and should not be approved, except in very special circumstances. The PPTS states that Green Belt boundaries should be altered only in exceptional circumstances. It states that if a local planning authority wishes to make an exceptional, limited alteration to the defined Green Belt boundary (which might be to accommodate a site inset within the Green Belt) to meet a specific, identified need for a Traveller site, it should do so only through the plan-making process and not in response to a planning application. If land is removed from the Green Belt in this way, it says, it should be specifically allocated in the development plan as a Traveller site only.
(6) Settlement Hierarchy and Accommodating Growth
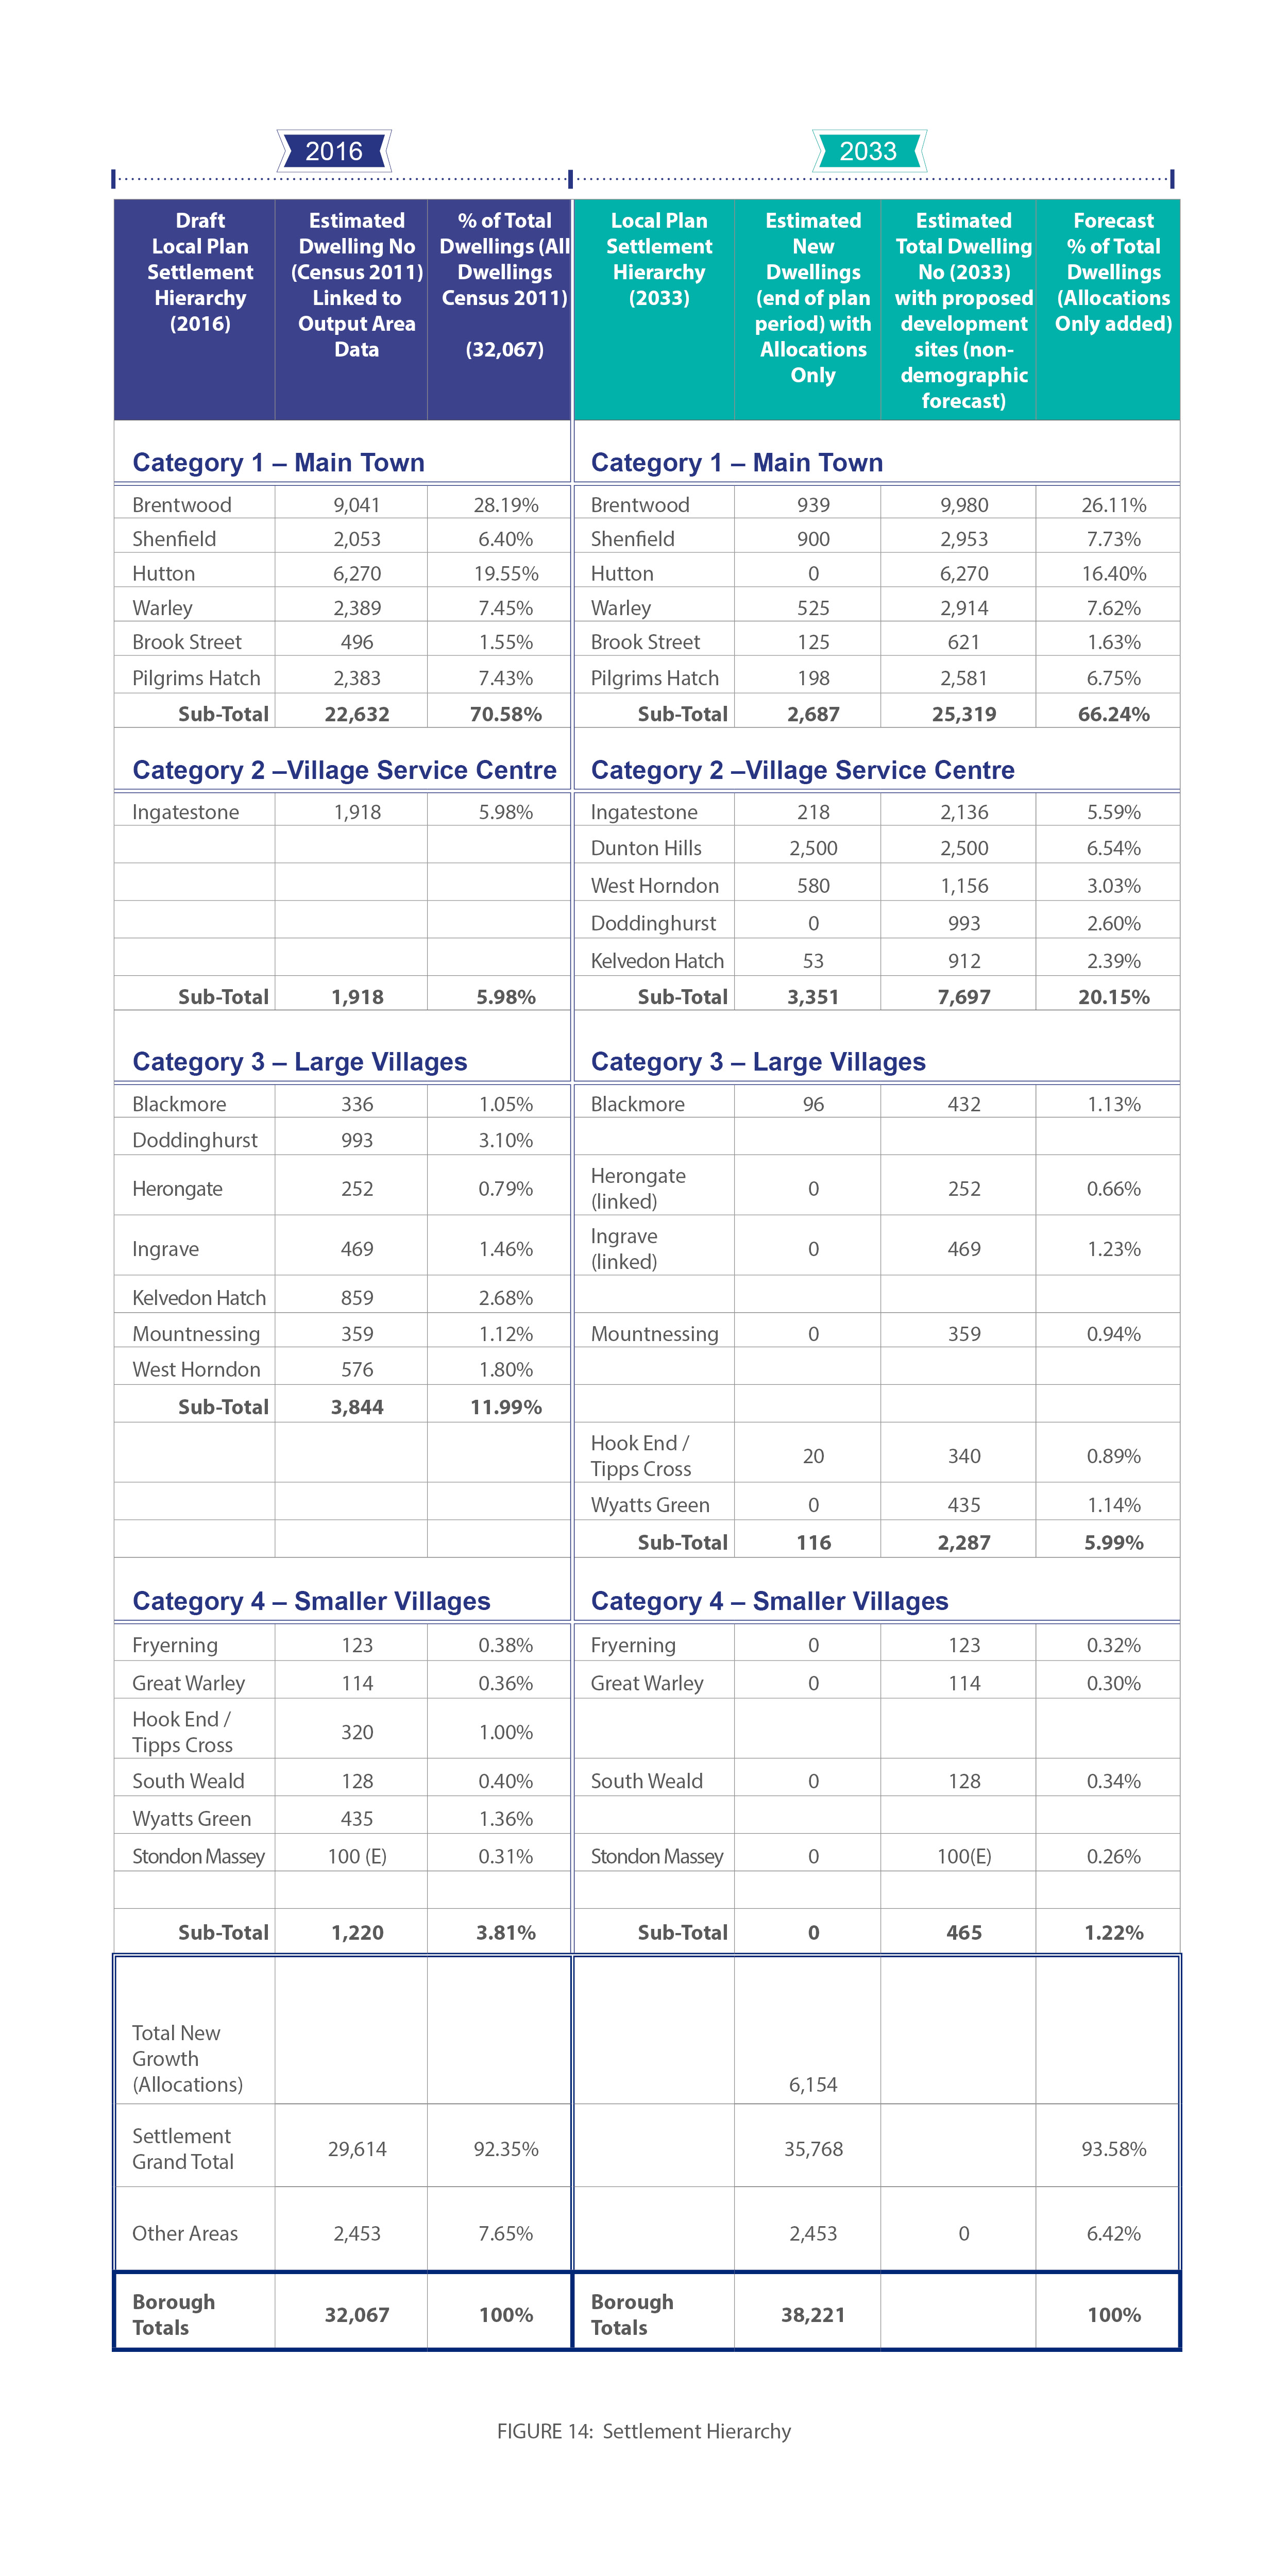
- With the introduction of a new settlement and additional housing growth, the hierarchy of settlements across the Borough will change. Figure 14 sets out information on the current settlement hierarchy (as detailed in the Draft Local Plan 2016) with an estimated breakdown of dwellings by settlement and also as a percentage of the total dwellings. The figure also includes information on the new proposed settlement hierarchy based upon allocated growth. Notable changes to the settlement hierarchy include an enhanced range of Category 2 service centres to include larger villages (West Horndon and Dunton Hills Garden Village). Between the Category 1 main town and Category 2 service centres, this accounts for over 86% of the borough's forecast dwellings.
(5) Figure 14 – Settlement Hierarchy
Infrastructure Planning
- The Council recognises that it is essential for the Plan to be supported by a comprehensive approach to infrastructure planning to ensure that new communities are supported by the right range of services and facilities at the right time, such as schools, transport, healthcare, places for sport and leisure and community facilities. Our Infrastructure Delivery Plan (IDP) accompanying this consultation document, includes extensive information on the current levels of infrastructure provision and forecasts needs linked to development pressures, across a number of key topic areas. Particular local infrastructure issues include schools and healthcare (doctor's surgeries in particular), which are discussed in this section.
(11) Primary Schools
- For the year 2016/17, the net capacity of non-independent primary schools in the Borough was 6,032 pupils across 24 schools[11]. In the immediate future (2017/18) the net capacity of non-independent primary schools will increase to 6,222 pupils mainly driven by expanding Hogarth Primary School to a two-form entry (2FE) with 420 pupil capacity.
- With the introduction of greater autonomy in the provision of education and the increasing number of academies, the role and responsibilities of local education authorities has changed. In Brentwood, Essex County Council acts as a commissioner rather than a provider of new schools. It has the duty to set out the requirements for any new school needed to serve a new community in order that potential providers may express their interest in providing that school. Where a Section 106 agreement provides the land and funding for a new school, the County Council will usually (but not in all cases) procure the school building and then transfer the new building for the successful provider to occupy.
- Regardless of whether schools have Academy status, are Free Schools, or are maintained schools, the County Council remains the responsible authority for ensuring that there are sufficient school places available within the county to meet the educational needs of its school age (5-19 years) population. This means that the County Council remains the appropriate authority to assess the requirements for school place provision arising from new housing developments in liaison with Brentwood Borough Council.
- Figure 15 provides an initial overview of primary school pupil capacity and various provisional pupil forecasts, including Column F which considers demographic trends and the possible pupil yield from housing sites with current planning permission. Column G links the proposed site allocations to schools and column H and I consider potential total pupil forecasts for each school generated by the allocations and whether there is forecast to be a surplus or deficit in school places. The figure is also ordered by the various school planning groups for the Borough.
- Most of the information contained in Figure 15 has been published by Essex County Council and the additional information on 'pupil yields' from housing developments has been calculated using standard equations[12]. This information remains in draft form as further work is being undertaken with the County Council to update the current planning permission data and implications for pupil yields and school capacities. Figure 15 should therefore be considered an initial overview only, but useful in highlighting potential education infrastructure pressures. A RAG system has been used in the figure to identify areas of high pressure / shortages (red), 'at capacity' (amber) and limited capacity (green).
- It is generally accepted that education provision in an area should not operate at 100% of its capacity, as it is important to retain some level of surplus places. The National Audit Office report 'Capital Funding for New School Places' (2013) refers to a minimum 5% surplus that the Department for Education assumes in its planning as necessary to support operational flexibility (mid-year admissions) and facilitate parental choice. A deficiency may thus be deemed to exist without the certainty of every local place being filled.
(3) Figure 15: Primary School Capacity

- It is clear from Figure 15 that there are a number of
projects and future options which need to be explored to
support sufficient education infrastructure to meet the needs
of forecast 'organic' growth reflective of demographic
changes and current planning permissions and also the
proposed housing allocations. We will continue to work with
Essex County Council and other partners (including local
schools) to finalise a list of solutions to addressing the
shortage of primary school places within the Borough.
Potential projects may include:
- Brentwood Town Group 1 – expansion of various established primary schools (permanent expansions and bulge cohorts) and the development of potentially up to two new 2FE primary schools. We are keen that new primary school developments are located within close proximity to major new housing developments, such as Officer's Meadow, to maximise opportunities for sustainable travel to school options. The development of flexible criteria based policies may be required in the Plan to ensure that schools located within the Green Belt have sufficient opportunities to expand in a sustainable manner.
- Ingatestone and Mountnessing Group 2 and Doddinghurst and Kelvedon Hatch Group 3 – identify opportunities for permanent and / or bulge cohort expansions to support a limited range of housing growth within Ingatestone and the borough more sustainable villages. Again, a criteria based policy may be required to support the development of schools located within Green Belt locations.
- None Grouped – review of options to expand West Horndon Primary School to include expansion, redevelopment or new build. We will work with Essex County Council and other partners including the school to explore the best option to accommodate additional pupil growth over the short and longer term.
- The new Dunton Hills Garden Village settlement is not covered by the information contained in Figure 15, but this development is forecast to require significant investment in education infrastructure. The primary school pupil yield from Dunton Hills for 4,000 dwellings is circa 983 pupils. This calculation utilises the County Council's standard multipliers[13]. It is important to note that analysis within Essex of large scale 'young and mature' settlements, indicates that some new settlements particularly in their early years may generate a higher number of children (groups 1-4 years and 5-15 years) than more mature settlements as reviewed over time[14].
- The delivery of new primary school infrastructure at Dunton Hills could take several forms and we are working with partners to finalise the right mix to support the growth of the new village. This new infrastructure could include:
-
- 1 x 2/3 FE primary school possibly integrated within a larger 'all through' school academy on the site; and a
- 1 x 2/3 FE primary school on another part of the site to service another area of the village.
- Different options are being explored through the ongoing masterplanning for the site.
- The accompanying Infrastructure Delivery Plan (IDP) contains further detailed information on site phasing and pupil yields per annum, with 2021/22 identified as a critical year for the start of built out of many housing sites. The timely delivery of new education infrastructure is fundamental to ensuring that both existing and new residents are able to access schools with sufficient pupil capacity within easy access. It is recognised that not all sites will build out at the same time and consideration will need to be given to critical per annum trigger points for when new education infrastructure will need to be in place.
(5) Secondary Schools
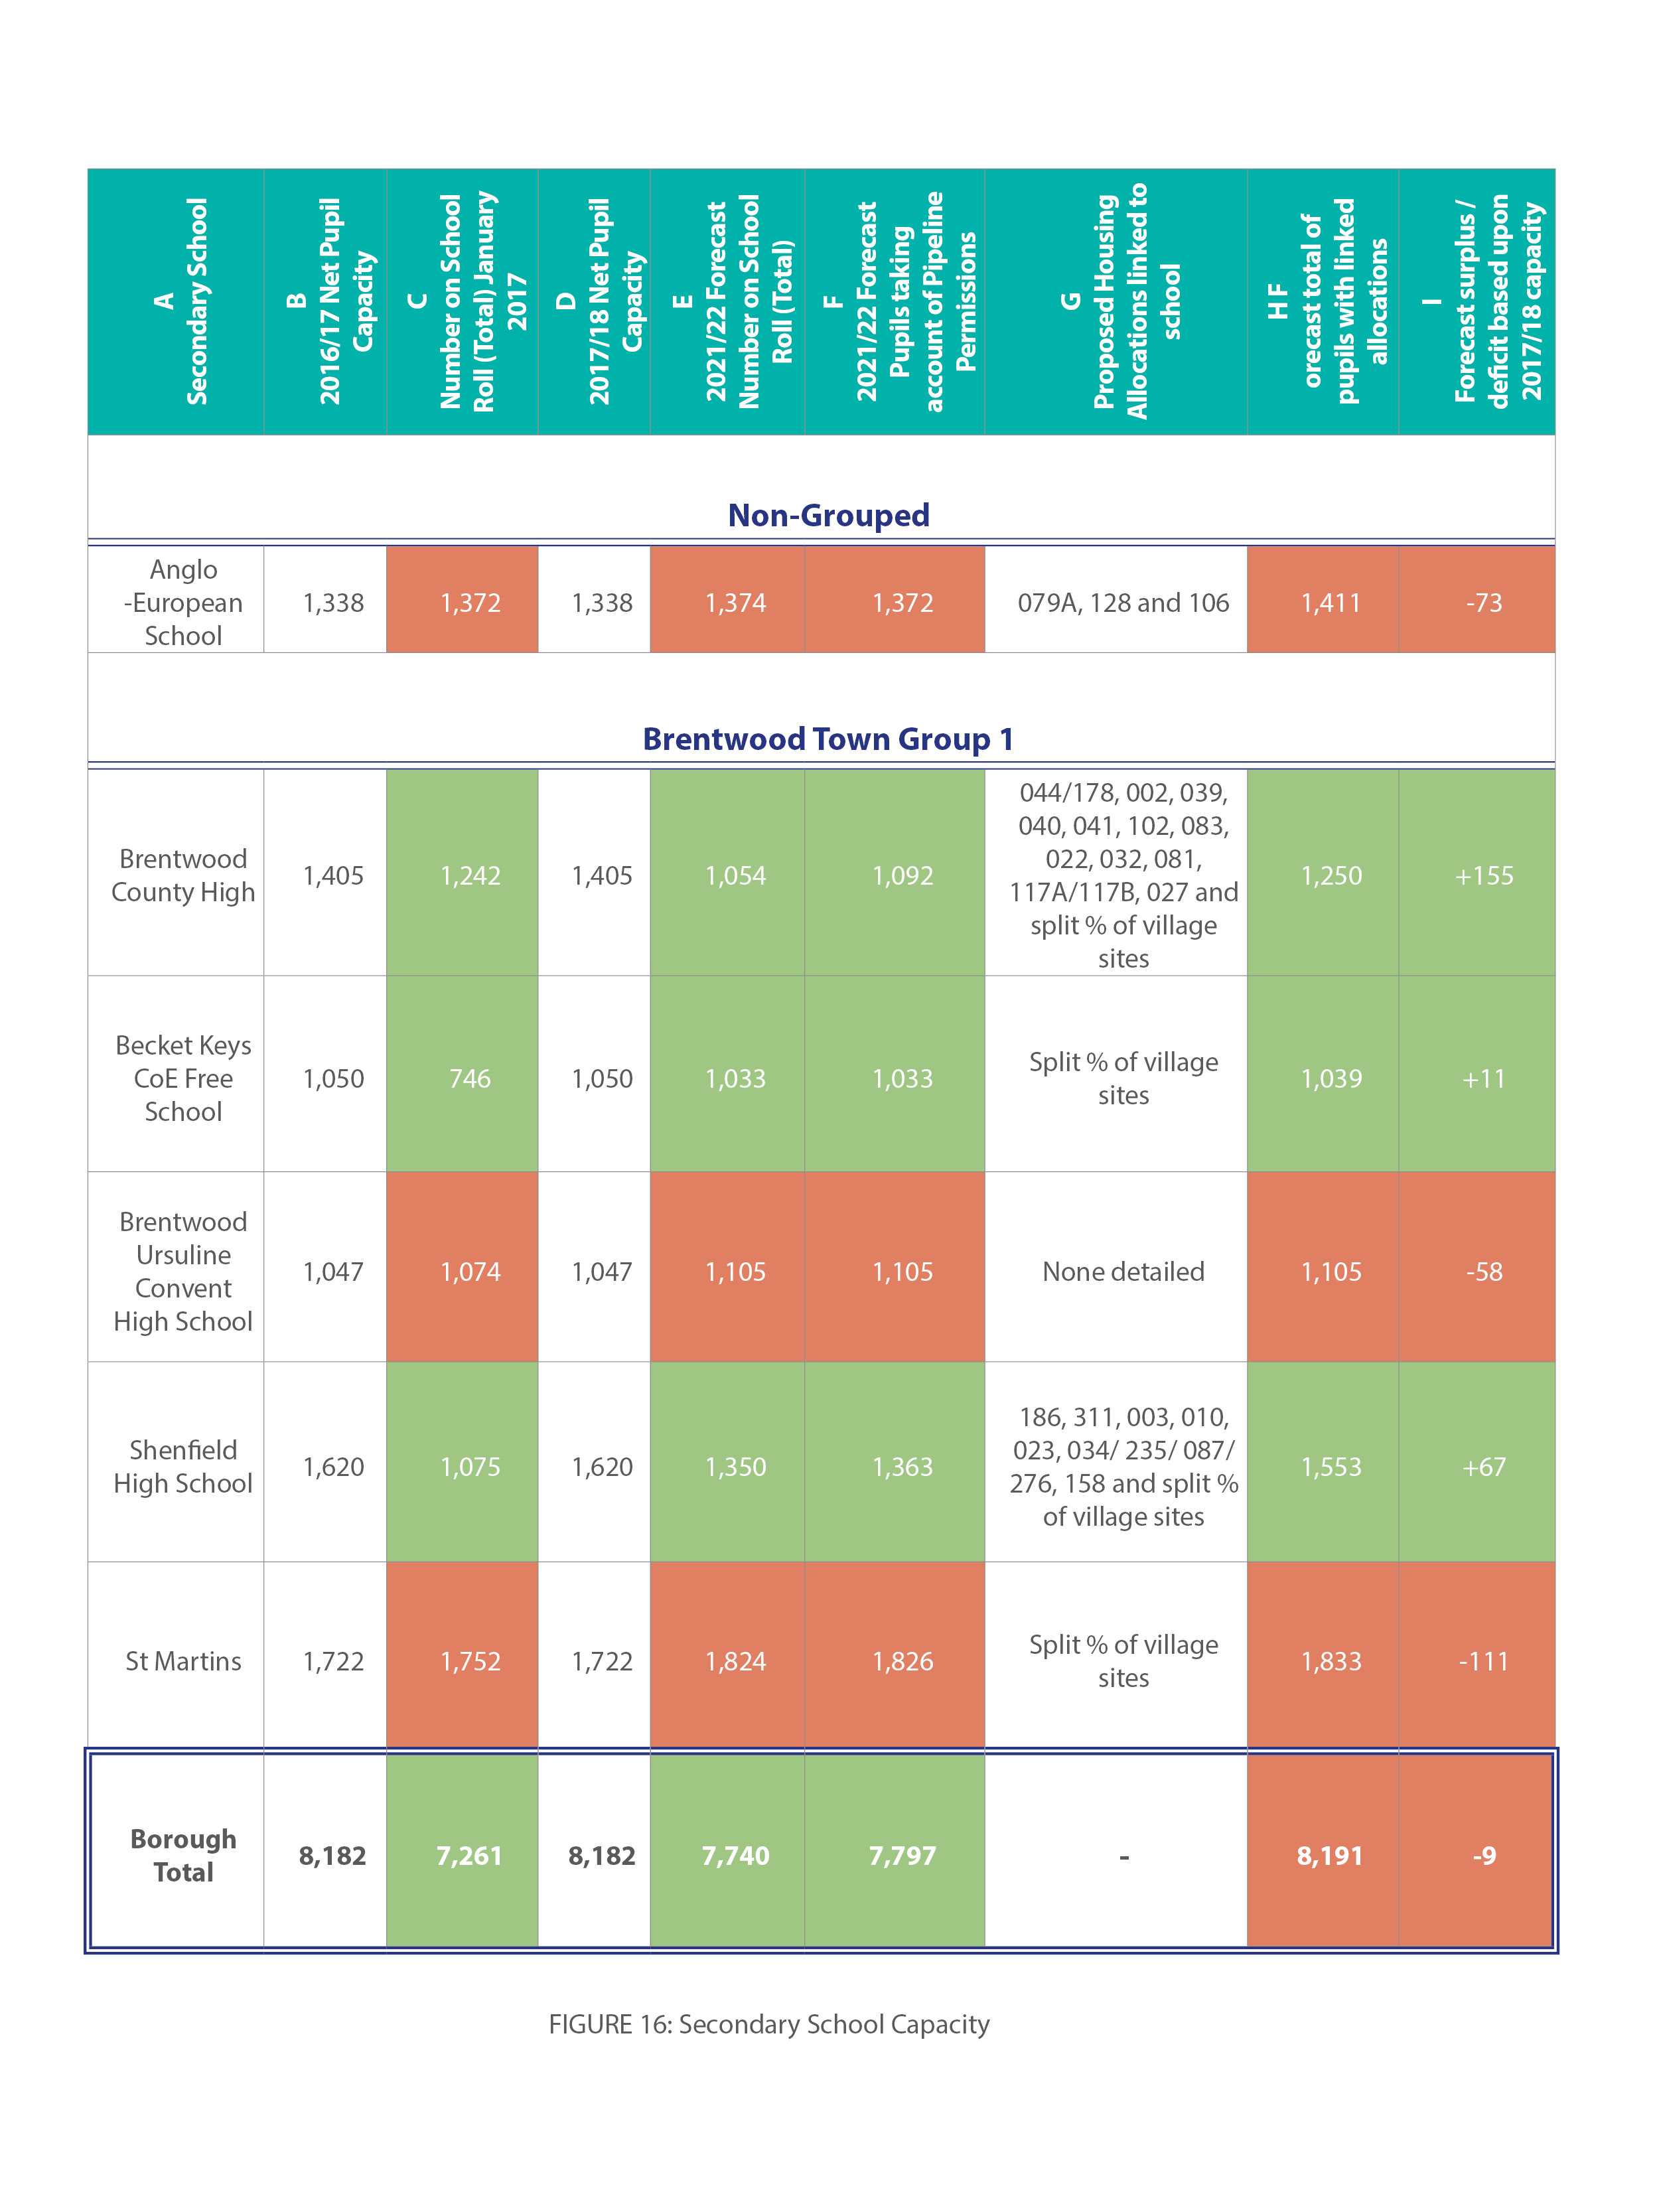
- At the start of January 2017, the net capacity of non-independent secondary schools within the Borough was 8,182 across six schools. Brentwood is known within Essex and the wider area for the quality of its secondary schools and a reasonable proportion of pupils' travel from outside the Borough to access education.
- Based upon a similar approach to that used in analysing primary school capacities, Figure 16 sets out the initial position on current secondary school facilities. Further technical work is currently being undertaken on planning permissions and potential pupil yields and this may change some of the data forecasts. The findings should therefore be considered as work in progress at this stage. Column C and D includes information on total school roll for years 7-11 and sixth form where applicable. The proposed housing allocations are then linked to schools as detailed in Column G with Columns H and I providing forecast pupil levels with allocations and an assessment of surplus / deficit.
- A RAG colour coding system has been used to identify school capacity issues. Much of the information contained within Figure 16 (excluding pupil yields from potential allocations) has been published by Essex County Council and the calculations for the pupil yields per site use standard formulas.[15]
- Figure 16 indicates when reviewing the Borough as a whole there is a general narrowing of available secondary school capacity, with the housing allocations potentially creating a small deficit position. Options are being explored with the County Council and other partners on a limited increase in the capacity of existing secondary schools to provide sufficient school places.
- As with the primary schools, the new garden village at Dunton Hills and associated infrastructure is not covered in Figure 16. The combined pupil yield from the forecast build out of Dunton Hills and nearby proposed allocation sites at West Horndon indicate a yield of about 721 secondary school pupils. Due to the location of Dunton Hills on the border of both Basildon and Thurrock, this does not take into account any potential pupil yield from developments within neighbouring authorities. The Council are working with the County Council and other stakeholders to define the exact minimum scale of the secondary school infrastructure provision for Dunton Hills, which may take the form of an integrated 'all through school', with a linked primary school function.
Figure 16: Secondary School Capacity
(2) Special Education Needs
- According to the Department for Education[16], across all schools the number of pupils with special education needs has remained stable at about 14.4%, with special educational needs classified as:
-
- Special Education Need Support – extra or different help from that provided as part of the school's usual curriculum; and
- Statement of special educational needs or Education, Health and Care (EHC) Plan – a pupil has a statement or plan when a formal assessment has been made.
- About 2.8% of the pupil population has a statement or EHC plan.
- There are two special main schools within Brentwood Borough which provide specialist education support for children with special or complex educational needs – the Endeavour School and the Grove House School. Each school has a small pupil intake (118 pupils at the Endeavour School and 105 pupils at The Grove House School). It is understood that there are considerable physical capacity constraints at the Endeavor School which limits options for the school to extend to provide a much needed sixth form function to support existing pupils looking to continue their education and provide a facility for pupils moving from other local schools.
- The Council be looking to support the further development of the Endeavour School to provide facilities for sixth form students. This education requirement will need to be built into the detailed layout and masterplanning for the proposed housing site at land at Priests Lane (044/178).
(34) Healthcare – General Practice
- Public Health England produce a series of public health profiles through its research observatory, which is available now as an online resource and infographics[17]. From this profile it can be noted that the health of people in Brentwood is generally better than the England average, with life expectancy for both men and women higher than the England average. The Basildon and Brentwood Joint Service Needs Assessment (JSNA) also provides a detailed overview of demographics and public health issues facing Basildon and Brentwood[18]. Both the public health profile information and JSNA are discussed in further detail in the IDP and included as technical data sets.
- NHS England and the NHS Basildon and Brentwood CCG (BBCCG) are working together to help plan and develop new ways of working within primary care facilities, in line with the BBCCG's Five Year Forward View plan[19], to increase capacity in ways other than physical space. NHS England is also endeavoring to develop sustainable solutions through proactive co-ordinated care, including hubs, rather than the individual replacement of surgeries. There is also a significant focus upon premises for training and increasing capacity through technology.
- There are ten NHS GP Surgeries (eight main surgeries and two branch surgeries) covering the Borough, which are detailed in Figure 19. With the changing nature of GP practices and emphasis upon increasing access to healthcare through technology and remote access to professional advice, it is not always an easy task to analysis the impact of new housing on the current healthcare infrastructure, and indeed plan for new infrastructure. There is no recommended number of FTE GPs per 1,000 patients per practice, recognising the differing needs of the registered patients at GP practices; the various focus of GP practice plans and strategies developed to utilise their workforce to best meet the needs of their patients. For planning purposes NHS England (NHSE) use 120m2 of premises space per 1,750 patients.
- Figure 17 provides a snapshot only of the GP surgeries within the Borough and highlights potential pressure points linked to housing development and additional potential patient numbers. The figure provides information which is generally publically available and should be treated as an initial indicative guide only and not a definitive overview. It does not provide commentary on the performance or quality of service received at each GP practice or indeed measure the quantity of GP premises space per level of patients. Figure 17 also includes three datasets from the Joint Needs Assessment for Basildon and Brentwood, covering the GP Practice Indices of Multiple Deprivation scoring, number of disability claimants per 1000 in the GP practice area and % of the population in the GP practice areas with a longstanding health condition. A simple (RAG) coding system has been used to indicate comparisons with generally national data-set averages.
- From the information detailed in Figure 17, it can be noted that the number of Full Time Equivalent (FTE) GPs per 1,000 patients across the majority of surgeries in Brentwood is lower than the national average of 0.58. Only three of the surgeries (Highwood, Mount Avenue and West Horndon) are about average. The number of FTE Nurses per 1,000 patients paints a slightly more positive position, with The New Folly, Mount Avenue and Deal Tree all indicating a higher than national average level of access. The proposed range of housing growth is likely to further intensify the number of patients per GP for the vast majority of surgeries across the Borough, with Beechwood, Rockleigh, Highwood and West Horndon likely to witness potentially significant uplift in patient numbers relative to the level of currently registered patients.
- Discussions with the BBCCG have generally indicated no particular current 'gaps' in the front-end GP services, although it is noted that a number of practices may be under pressure in terms of patient numbers and potential healthcare issues due to their geographic location. Where there are potential gaps in infrastructure, this relates more to the provision of supporting infrastructure such as superfast broadband and public transport connectivity, to ensure that they can deliver a variety of healthcare services to patients through a range of media and that services are accessible to all.
- The BBCCG's current strategic focus for health infrastructure provision within Brentwood concentrates upon:
-
- adding depth and range to existing GP services, by
building upon local expertise, collaboration between
practices and combined learning;
- providing patients with wider access to health
information and services through media and on-line
resources;
- better aligning community health and social care;
and
- maximising opportunities to develop Brentwood Community Hospital in terms of the range of services and specialisms.
- adding depth and range to existing GP services, by
building upon local expertise, collaboration between
practices and combined learning;
(2) Figure 17 GP Practices in Brentwood Borough

- Current infrastructure services improvements alone are unlikely to address the significant patient pressures that may occur through housing growth in the Borough during the lifetime of the plan. Within the Brentwood Urban Area opportunities are being explored to enhance the range and scale of facilities offered through Brentwood Community Hospital, which could include GP services. West Horndon Surgery within the Thurrock CCG catchment area has also expressed a need to move to larger premises possibly related to the redevelopment of West Horndon Industrial Estate which could deliver modern healthcare services.
- Dunton Hills Garden Village has a projected new population of in excess of 9,000 residents and is strategically well located with the A127 growth corridor and close proximity to Basildon and parts of Thurrock. Opportunities are being explored to deliver new integrated health facilities at Dunton Hills to support the sustainability of the settlement and provide a strategically well positioned location for wider healthcare provision, potentially integrated with other community or commercial uses.
Employment Land - Need and Supply
(8) Economic Prosperity
- The National Planning Policy Framework (NPPF) provides a clear position on the need to build a strong competitive economy. In respect of local plans, it states at paragraph 21 of the guidance that the Plan should 'set out a clear economic vision and strategy for their area which positively and proactively encourages sustainable economic growth'.
- Brentwood is an attractive business location with a high-quality environment, within close proximity to London, a well-qualified workforce and good transport links. The Borough has a diverse economic base and total employment in the Borough has risen from 30,900 in 1997 to 43,200 in 2016.[20] The Borough is well known for its entrepreneurial culture with above average rates of business start-ups, and is home to a number of major national firms whose regional headquarters are located within the Borough.
- The Council's current Economic Strategy[21] sets out a series of economic aims and strategic priorities which are reflected in the vision and strategic objectives of the local plan:
Economic Aims:
- A1. Promote a mixed economic base and a discerning and sustainable approach to economic growth;
- A2. Encourage high value, diverse, employment uses that will provide a significant number of skilled and high-quality jobs;
- A3. Encourage better utilisation, upgrading and redevelopment of existing land and buildings; and
- A4. Enable the growth of existing business, the creation of new enterprises and encourage inward investment.
Strategic Priorities:
- P1. Support business development and growth;
- P2. Facilitate and deliver skills and employability support;
- P3. Facilitate and encourage business workspace, infrastructure and inward investment;
- P4. Facilitate and support stronger and more vibrant town & village centres;
- P5. Develop and support the borough's rural economy; and
- P6. Promote Brentwood borough as a place to visit and invest, encouraging the visitor economy.
- The evidence base on employment land need and supply (Economic Futures Report 2013-2033: Final Draft Report) has been updated to ensure that the right level and range of employment land is available to support a dynamic local economy and that the economic forecasts are as up to date as possible and align to the current plan period. Work on housing need and employment land need and supply have also been run in parallel to ensure that any cross-over issues are considered and addressed in both the SHMA and Economic Futures update report.
Functional Economic Market Area
- The updated economic evidence also includes an assessment of the Functional Economic Market Area (FEMA) for the Borough, which considers a number of evaluation factors including travel to work areas, commuting flows, the commercial property market area; retail market areas, local economic partnership areas and strategic transport routes to define the key economic linkages and spatial relationships. Producing a FEMA is not an exact science and often represents just a snapshot in time, but is useful in indicating the Borough's broad core economic geography and connections. Figure 18 sets out the Brentwood FEMA.

- In considering site employment site allocations and growth, the Council has also considered commercial agent feedback on employment sites to ascertain the level of market interest, views on strategic locations and commentary on employment land take-up and overall deliverability.
- In considering employment forecasts for the plan-period evidence spreads the risk of econometrical forecasting by using four baseline economic forecasts / scenarios for the Borough from 2013-2033, and provides forecasting in line with national planning policy guidance. The scenarios used are:
-
- Scenario A - the Experian employment forecasts as used in the latest SHMA;
- Scenario B- the East of England Forecasting Model (EEFM) employment forecasts;
- Scenario C - an Objectively Assessed Housing Need (OAN) of 380 dwellings per annum; and
- Scenario D - past B class development rates.
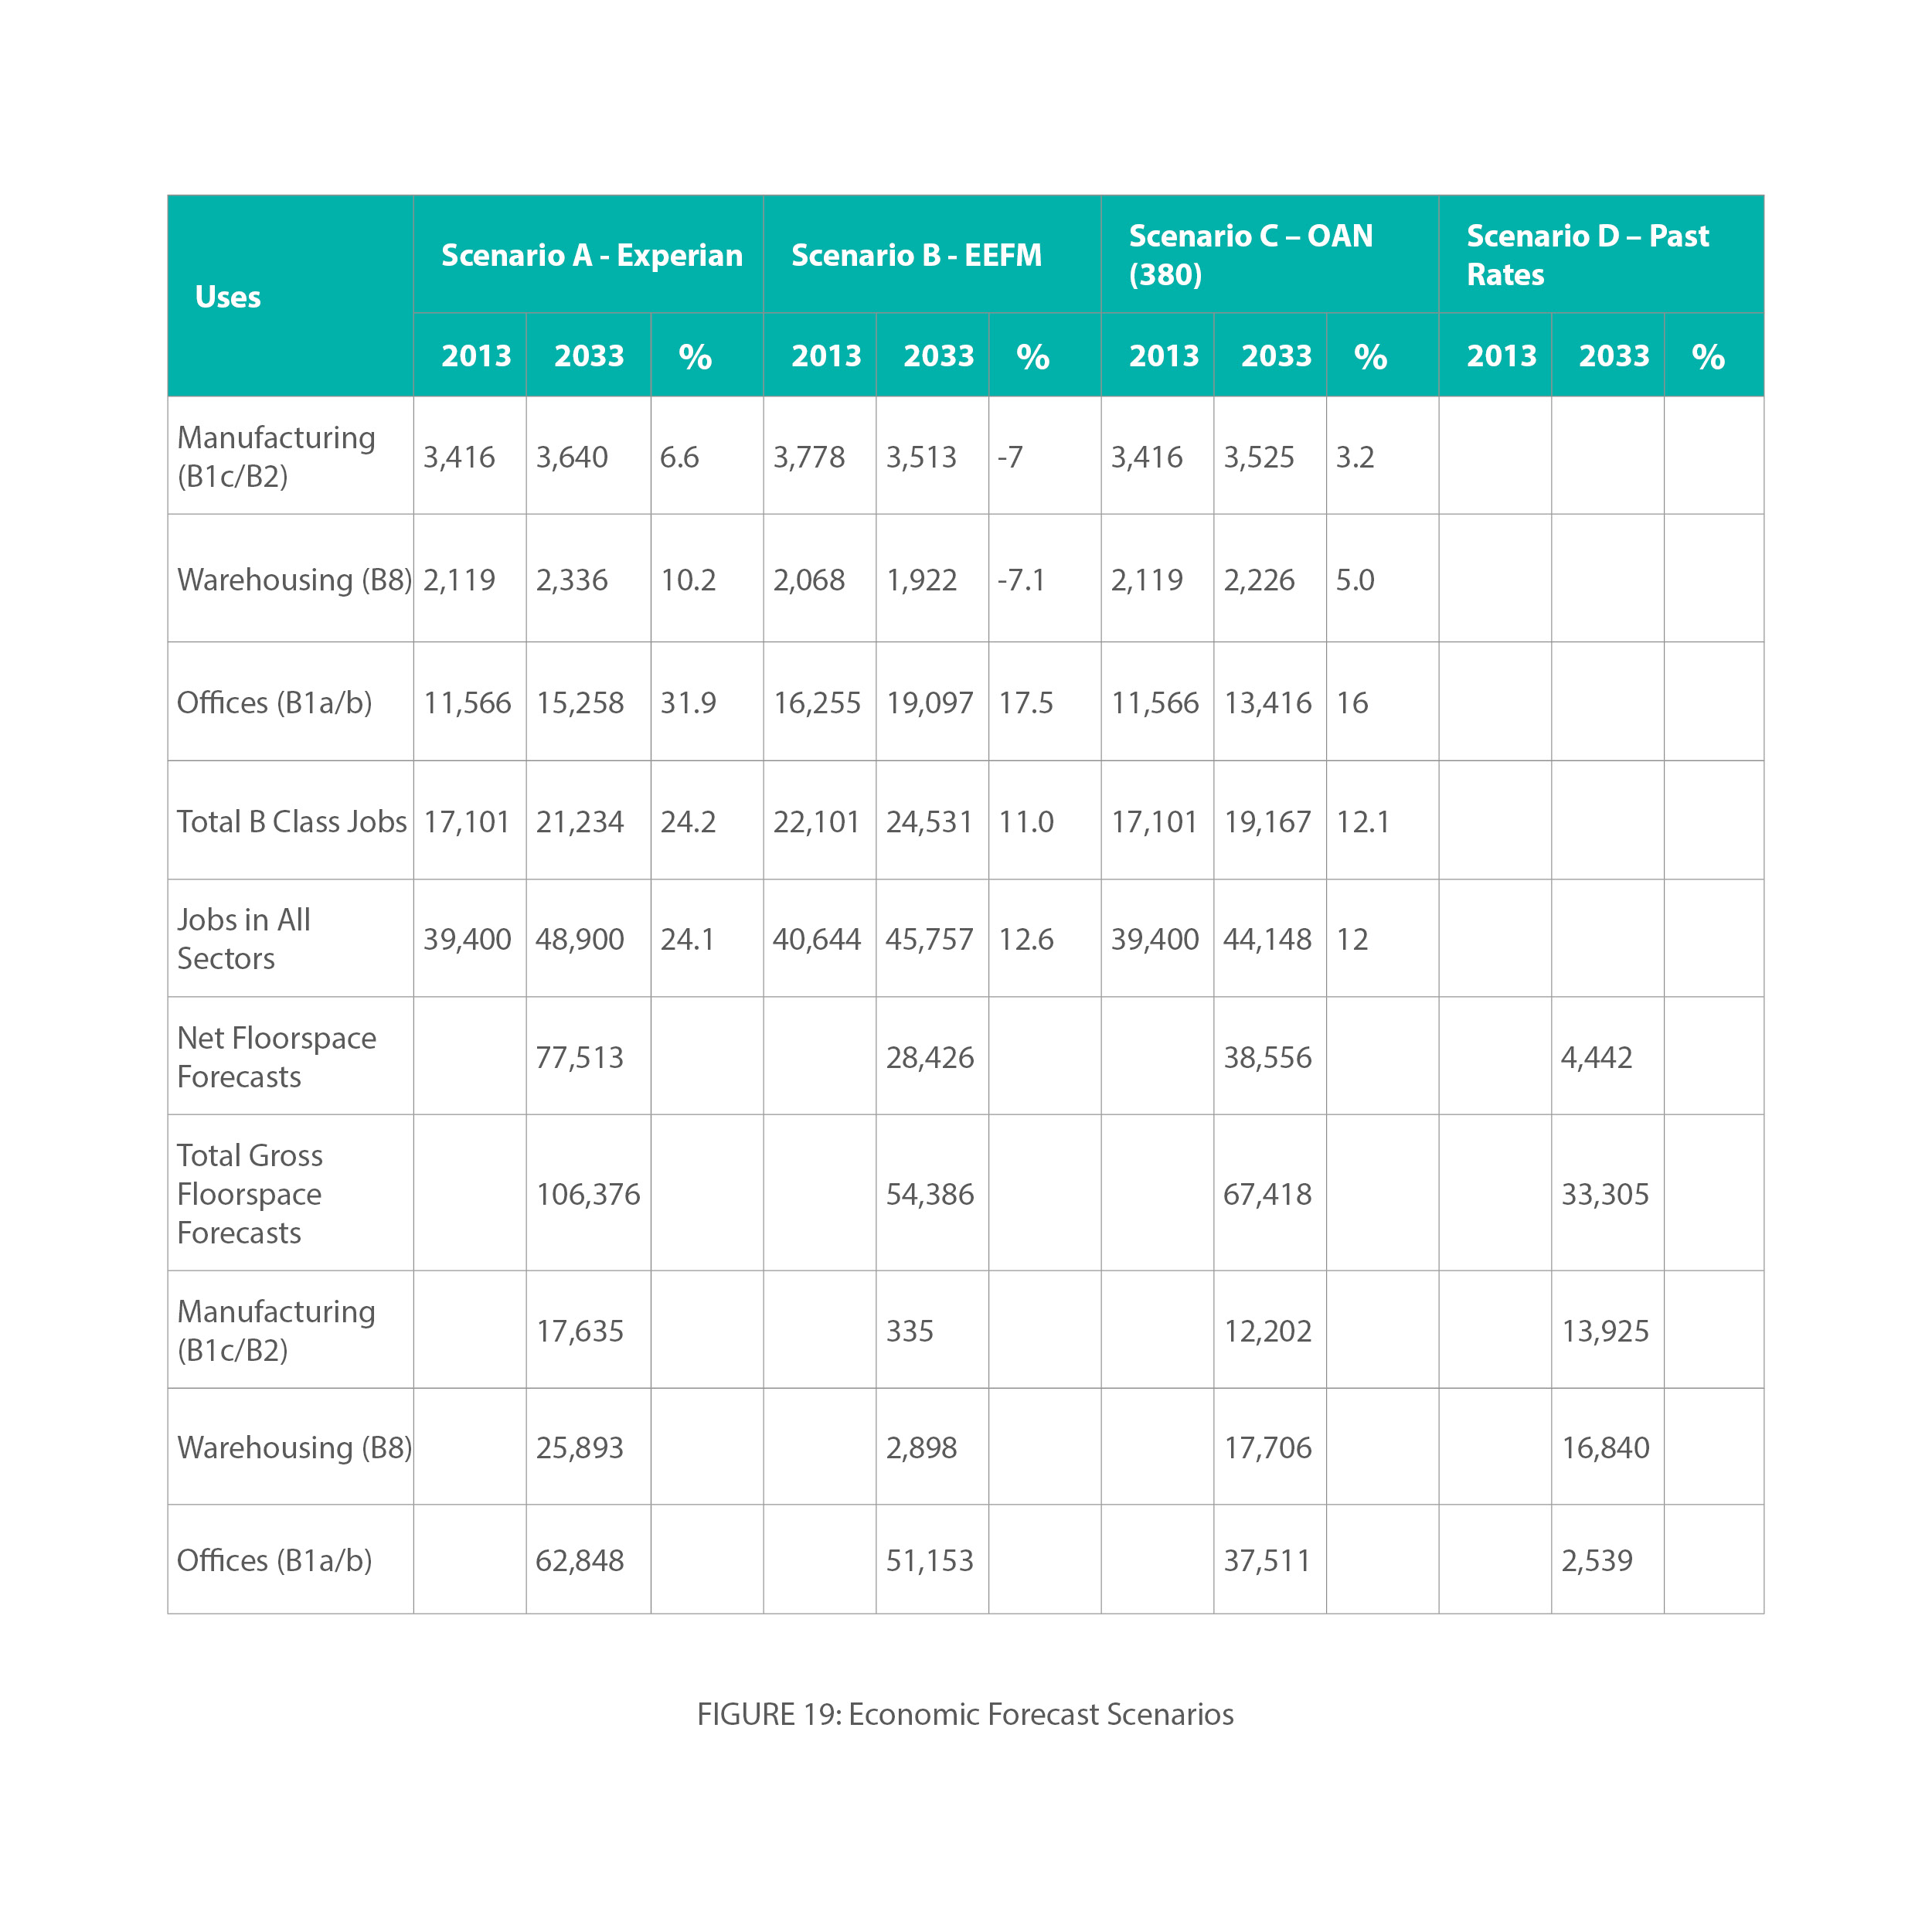
- Figure 19 summarises the outputs from the various approaches to forecasting to indicate changes in jobs by sector and in total, plus linked floorspace requirements. It can be noted in Scenario A (Experian) the overall positive growth forecasts in the model across all B classes, with a total percentage growth of 24.2% between 2013 and 2033. The EEFM is more cautious with reductions in B1c/B2 and B8 sectors while the OAN base model is forecasting growth in each B sector but at a reduced scale to Scenario A. Scenario D (past rates) generally forecasts very low growth rates in total. All scenarios predict an increase in employment land requirements.
- This analysis provides a range of job forecasts which can then be converted into net floorspace requirements of between 4,442 m2 (Scenario D), 28,426 m2 (Scenario B), 38,556 m2 for Scenario C and 77,513 m2 for Scenario A. Adding a safety allowance for such factors as delays to site delivery and a conversion factor from net to gross floorspace completes the calculation for gross floorspace by scenario requirements as detailed in the final four rows of Figure 19.
(1) Figure 19 – Economic Forecast Scenarios
(6) Employment Land Requirements
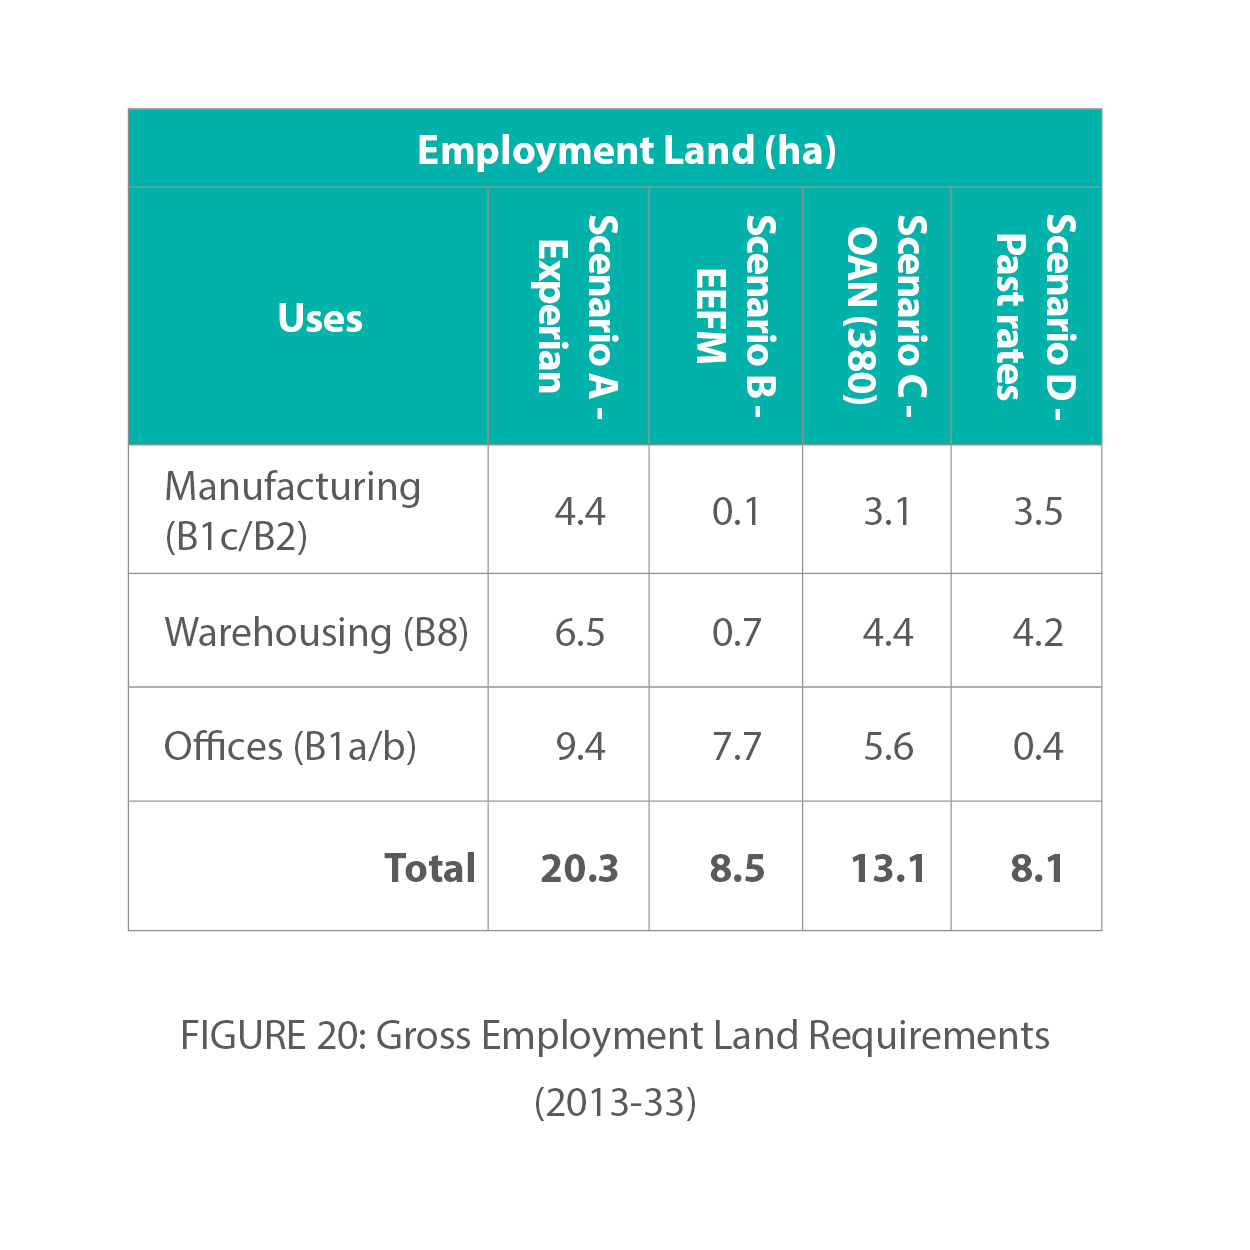
- Using a series of standardised site plot ratios it is then possible to calculate the estimated gross employment land requirement (hectares) for the new local plan, which are detailed in Figure 20. Total new gross employment land requirements therefore range from 8.1ha to 20.3ha.
- In addition to the forecast gross employment land requirements detailed above, it is also important to note that the Council proposes to allocate a number of existing employment sites for residential / mixed-use redevelopment as set out in the Draft Local Plan (2016). Examples include:
-
- Wates Way Industrial Estate – 0.99ha gross
- Council Depot site, Warley – 1.71ha gross
- West Horndon Industrial Estate – 15.06ha gross
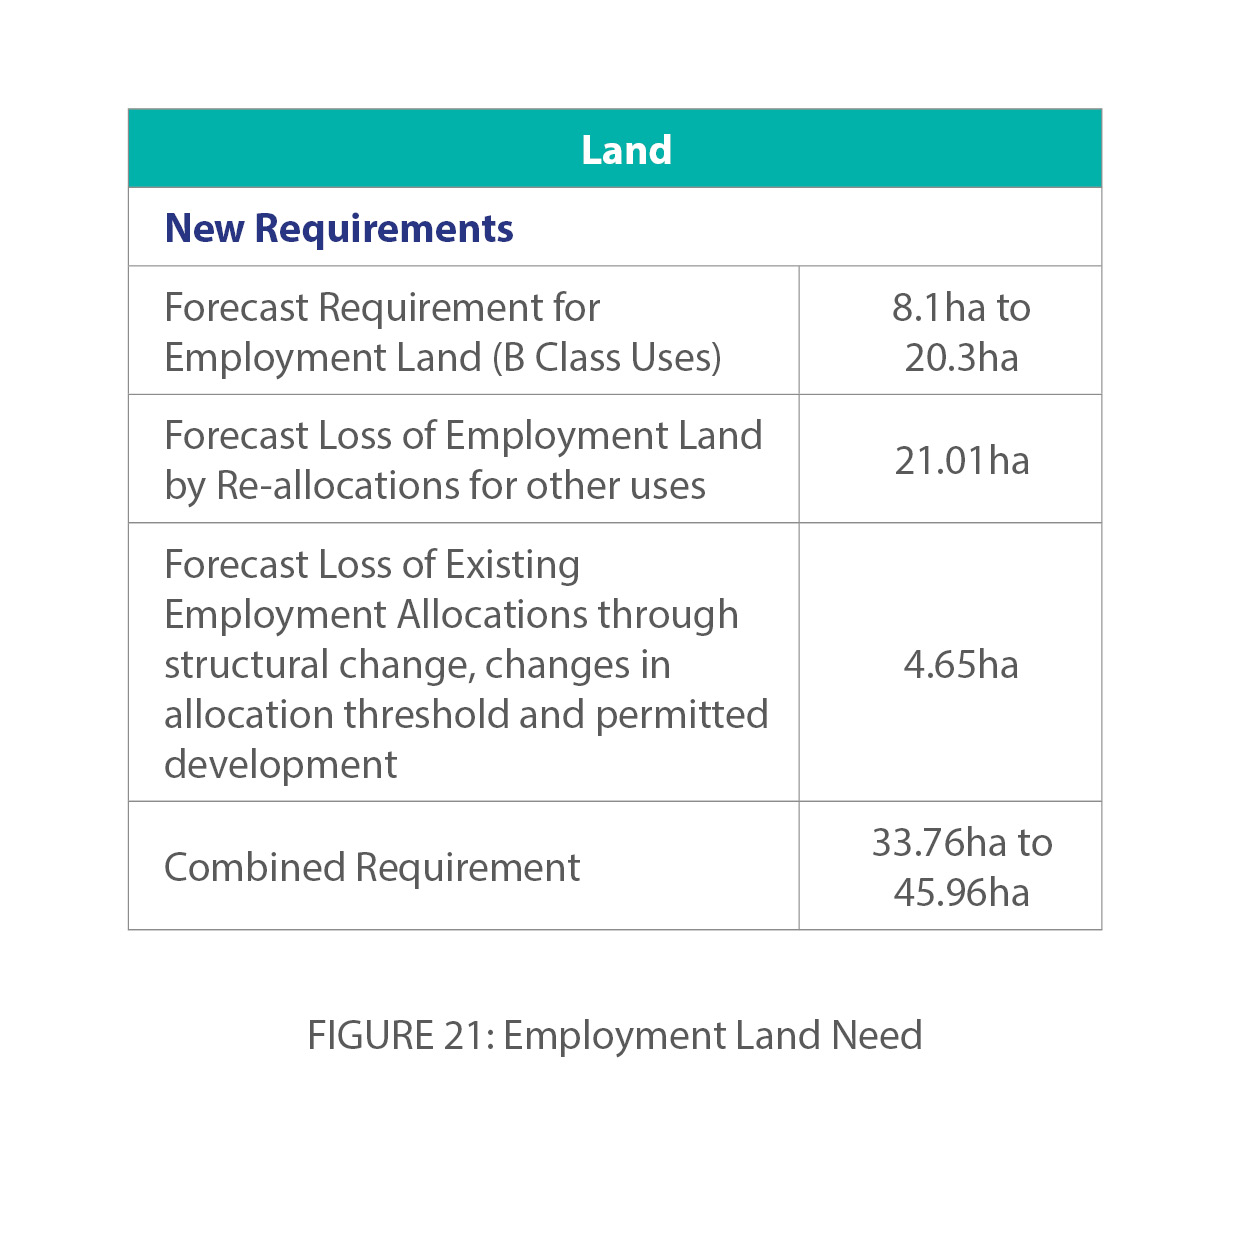
- A further existing employment site (Ford Offices, Eagle Way) has also come forward through the HELAA process to indicate possible suitability for residential development. Warley and surrounds consists of a mixture of land uses with employment (particularly offices) being a major component. We are keen to see the continuation of employment uses in parts of the areas identified for possible redevelopment in Warley. The exact extent will be subject to detailed masterplanning, approximately 2ha has been set aside for retained employment uses leaving about 3.25ha if current brownfield employment land. The loss of existing employment land through potential reallocations is therefore circa 21.01ha.
- Before arriving at a final employment land requirement consideration has also been given to the forecast loss of existing employment allocations through structural change, planning permissions and changes to permitted development rights allowing office to residential conversions. This loss of employment space equates to about 4.65ha.
Figure 20: Gross Employment Land Requirements (2013-33)
- Figure 21 below summarises the forecast employment land need, which ranges from 33.76ha to 45.96ha.
(2) Figure 21 – Employment Land Need
(8) Employment Site Allocations
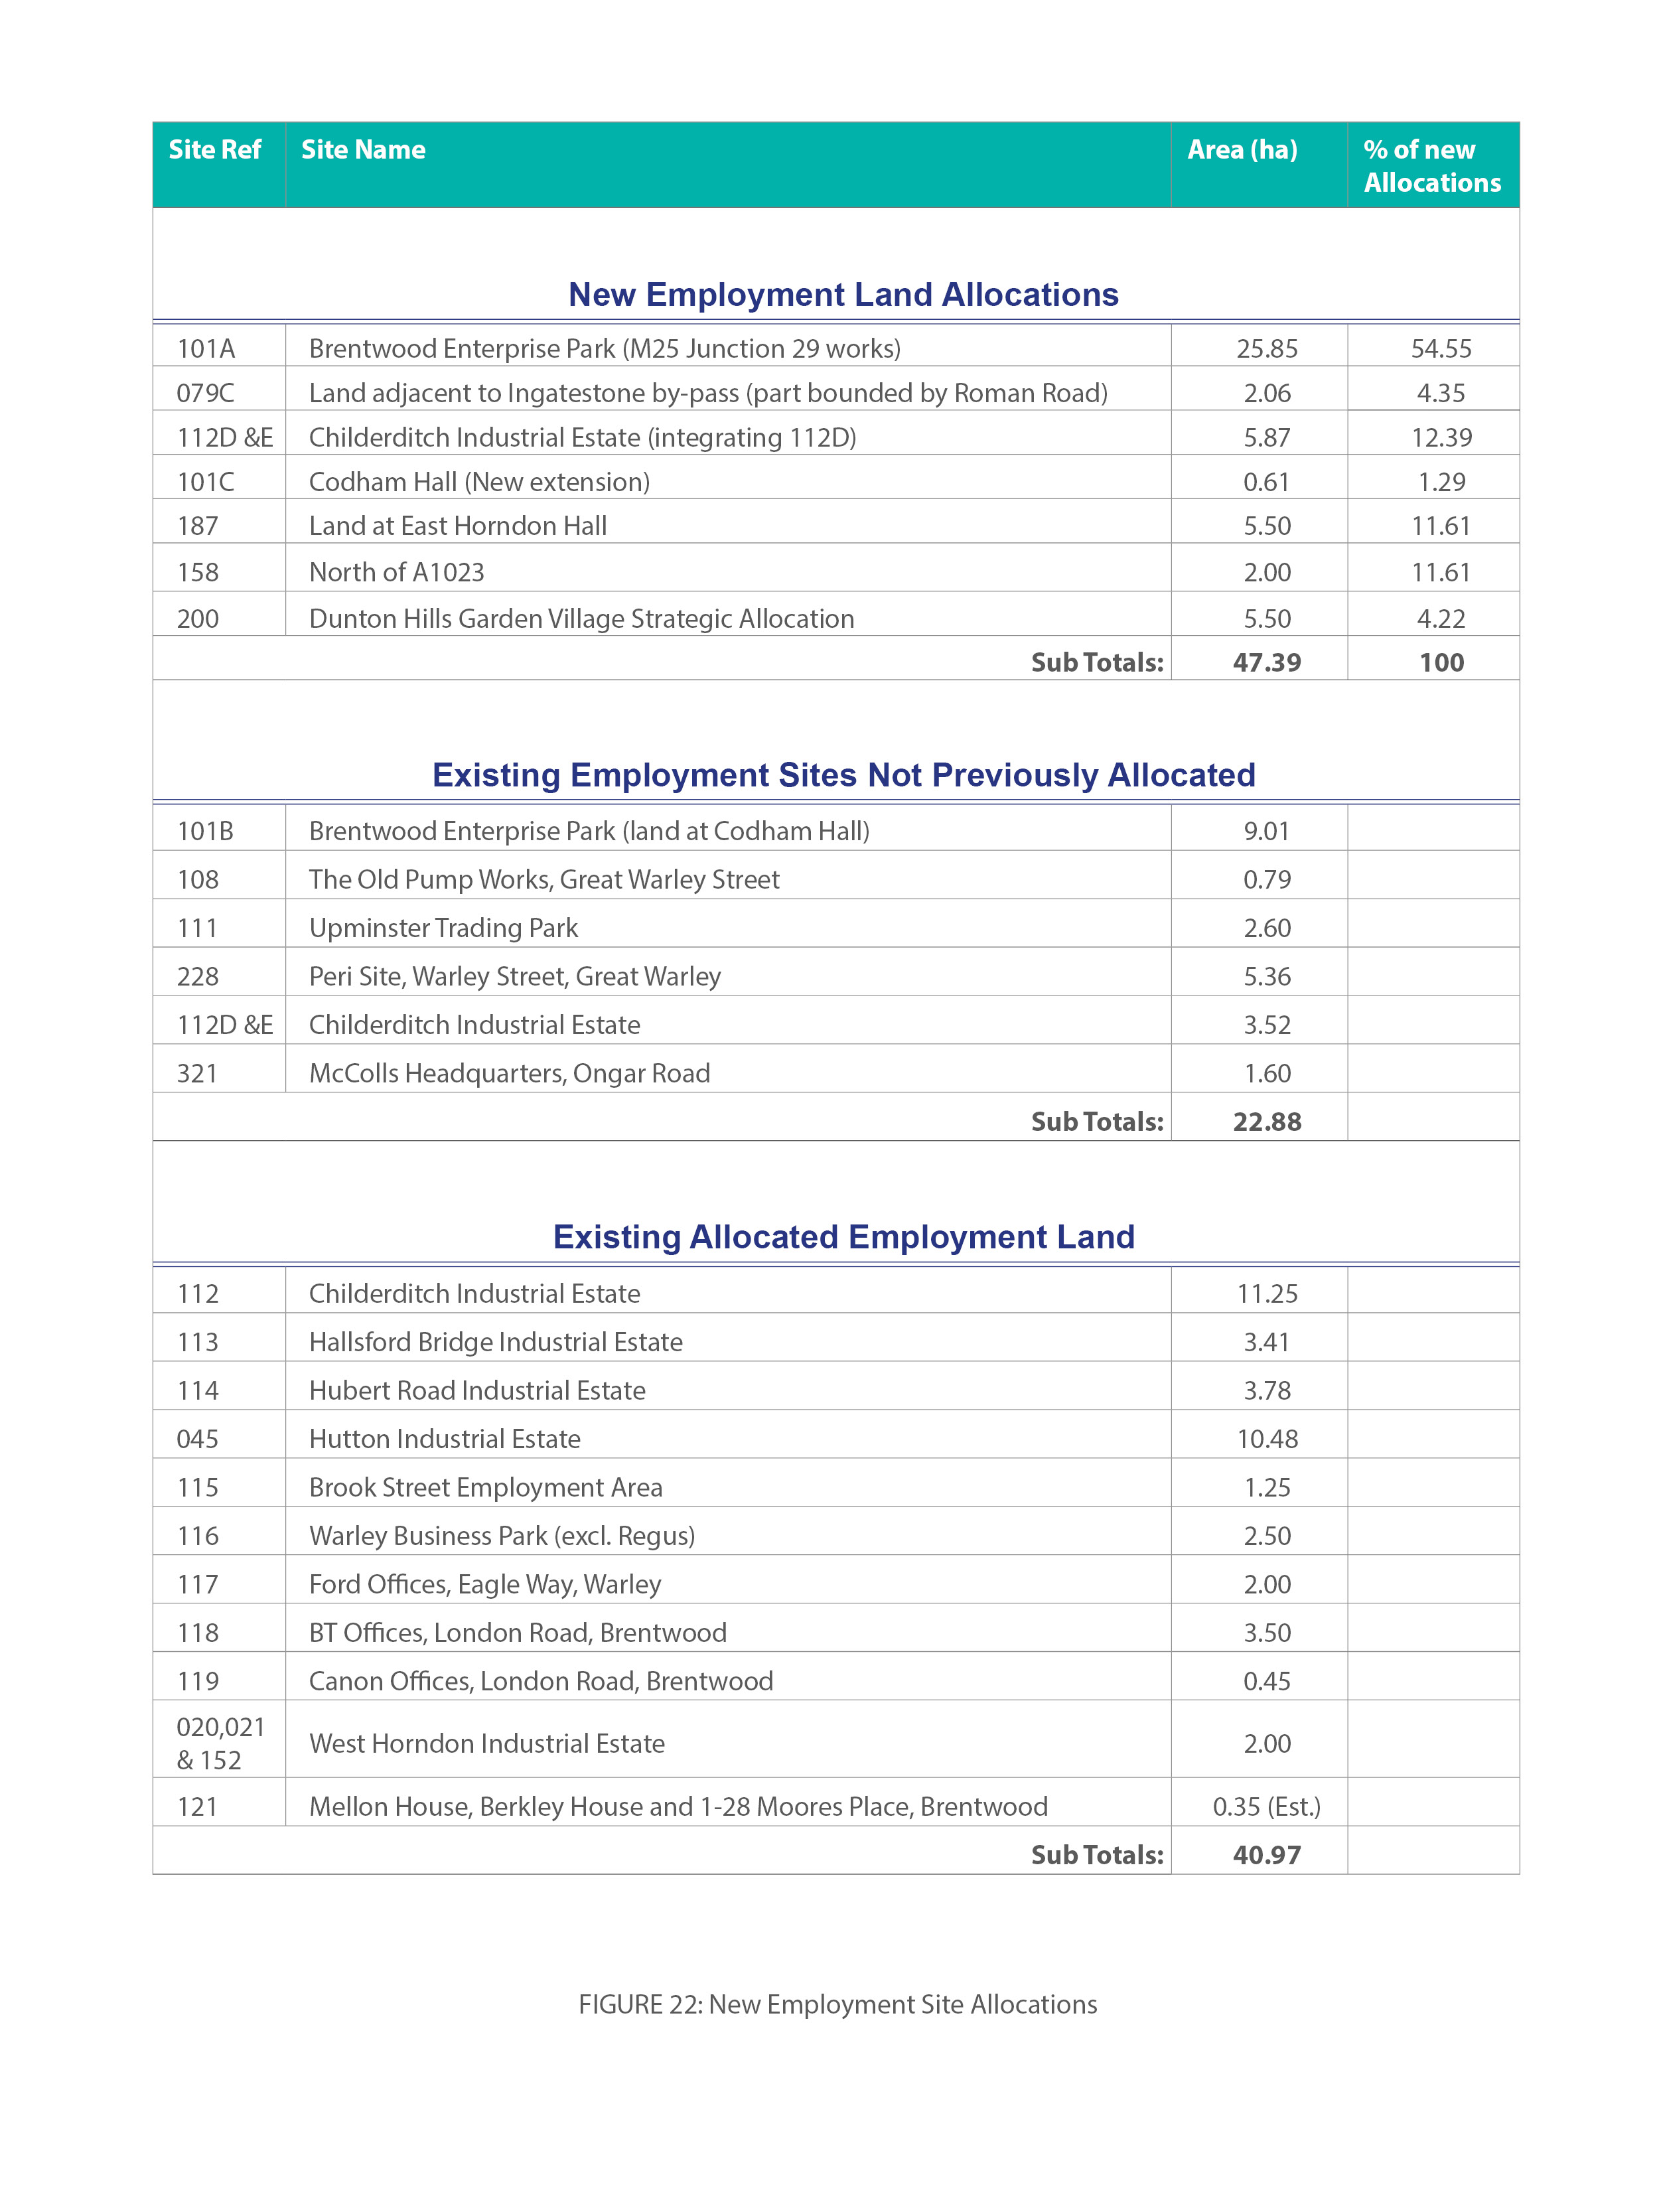
- In the Draft Local Plan (2016) the Council consulted on a range of potential employment allocations including a major new strategic employment site at M25 Junction 29 – Brentwood Enterprise Park. As with the housing sites referred to earlier in the report, we have undertaken further work on the scale, planning status, capacity and deliverability of potential employment allocations, existing employment sites (not previously allocated) and existing allocated employment land.
- The existing employment sites in the Borough which have not historically been allocated for employment uses will be 'regularised' as part of the Plan. This list of sites is likely to be extended to include operations within the farm area of Childerditch Industrial Estate (3.52ha) and McColls Headquarters on Ongar Road (1.6ha). As this list of sites contains existing employment uses it does not add to the overall new employment land supply.
- Since the list of existing allocated land was drafted in 2016, there has been a change in the size or threshold of sites for employment land allocations, which has been directed by research on the HELAA. It is proposed that only sites above 0.25ha (gross) will be allocated through the local plan process.
- This consultation continues to include the new site allocations detailed in the Draft Local Plan (2016) although further work has indicated an increase in developable site area – most notably at Brentwood Enterprise Park (up from 23.41ha to 25.85ha) and Childerditch Industrial Estate (up from 2.34ha to 5.87ha). In addition to the sites considered as part of the Draft Local Plan (2016) consultation, a small number of new strategically well-located sites are considered as suitable for allocation. These include land near Codham Hall, but not associated with current employment operations (0.61ha); land at East Horndon Hall – to the immediate north west of Dunton Hills Garden Village (5.5ha) and a small potential, allocation north of the A1023 (2.0ha). The exact range and type of employment development at Dunton Hills is still subject to detailed site masterplanning, but will need to be compatible with residential uses and of a human scale which is appropriate to a new garden village.
- In total, combining the updated original employment allocations from 2016 and the new potential allocation sites, this produces a potential new employment allocation of circa 47.39ha. Figure 22, sets out the new employment site allocations in total, plus employment site 'regularisations' and existing allocated sites. It can be noted that almost 55% of the new allocation is linked to the proposed Brentwood Enterprise Park.
- Figure 24 pulls the analysis together and considers at a macro level the overall employment land need and supply balance. It illustrates that at a high-level that the level of employment land allocations is broadly sufficient to ensure that the Council meets its overall forecast employment land needs (forecast new needs and losses from allocations and structural change)[22]. It is also recognised that the future restructuring of employment sites and businesses may change floorspace requirements.
- As noted, Figure 24 indicates that the level of proposed employment site allocations is broadly in line with top level forecasts for employment land need. With the introduction by Government of permitted development rights which enable offices to convert to residential this is forecast to have an impact on the office market in Brentwood, although not all current permissions will convert to the new residential uses. Figure 24 reflects some of this dynamic.
- One of the challenges the Borough faces moving forward is to develop an effective strategy and measures to retain an active urban office market (B1a/b) which is currently well supported by local SMEs within Brentwood – with high occupancy rates and premises located near local services, facilities and transport connections. The erosion of this important market may have a negative impact on the local economy.
- The economic futures report also indicates that in terms of other 'b uses' for example– manufacturing (B1c/B2) and warehousing / logistics (B8) that the portfolio of sites put forward in this consultation is likely to be attractive to the market and provide a sufficient range and high-quality offer. However, there is a clear need to ensure that strategic investment sites are well connected through public transport an active travel infrastructure to support their overall sustainability. Employment sites such as East Horndon and Dunton Hills will also need to be well connected to existing and new housing sites, including Dunton Hills Garden Village.
(4) Figure 22 – New Employment Site Allocations
- The new Plan will also need to effectively manage the period of transition for a number of current employment sites (such as West Horndon) moving from traditional employment uses to residential led-developments to ensure a clear pipeline of available employment land is achievable to meet the needs of businesses relocating to new premises within the Borough. The early delivery of strategic sites within the A127 corridor will be important to maintain an effective stock of employment land.
(1) Figure 23: Employment Land Need and Supply

[6] The Home Builders Federation estimate that when taking into account the supply chain and induced effects across organisations,operations and occupations, large scale housing development equates to broadly 4.3 jobs per new dwelling. The Econmic Footprint of UK House Building March 2015 HBF and Nathaniel Lichfield and Partners
[7] Essex Local Authority Portraits – A product of the Essex Joint Strategic Needs Assessment (JSNA) 'A Profile of People Living in Brentwood' May 2016 Organisational Intelligence, Essex County Council.
[8] The GTAA identifies 16 households where it has not been possible to determine the planning status. The needs of the households where an interview was not completed have been considered as part of the GTAA. Interview data collected and completed by ORS since the changes to PPTS in 2015 suggests that overall a national average of approximately 10% of households who have been interviewed meet the definition, in the absence of further information this ratio can then be applied to unknown households.
[9] NPPF Footnote 11: To be considered deliverable, sites should be available now, offer a suitable location for development now, and be achievable with a realistic prospect that housing will be delivered on the site within five years and in particular that development of the site is viable. Sites with planning permission should be considered deliverable until permission expires, unless there is clear evidence that schemes will not be implemented within five years, for example they will not be viable, there is no longer a demand for the type of units or sites have long term phasing plans. NPPF Footnote 12: To be considered developable, sites should be in a suitable location for housing development and there should be a reasonable prospect that the site is available and could be viably developed at the point envisaged.
[12] The potential primary school pupil yield from housing developments is calculated using standard ECC formula and assumptions. One-bedroom units and dwellings, such as student and elderly accommodation, are excluded from the calculation. The primary school yield from qualifying houses is thirty pupils per one hundred homes (0.3 per dwelling) with half this number – fifteen, expected from qualifying flats (0.15 per dwelling).
[14] Comparison of mature and young settlements by Cambridge Econometrics for North Essex Garden Communities.
[15] As with early years and primary school pupil forecasts, the Council has applied the ECC formula and assumptions for secondary school pupil forecasts. One bedroom units and dwellings, such as student and elderly accommodation, are excluded from the calculations. For secondary schools (including post 16 education or sixth form places) the yield is 20 pupils per 100 qualifying houses (0.2 per dwelling) and 10 pupils per 100 qualifying flats (0.1 per dwelling). Houses are classified as dwellings with two or more floors and with sole access to private outdoor space and maisonettes, trailers and bungalows (not chalet style bungalows with an attic room) may thus be treated as flats.
[17] https://fingertips.phe.org.uk/profile/health-profiles/data#page/0/gid/3007000/pat/6/par/E12000006/ati/101/are/E07000068
[18] Basildon & Brentwood CCG Integrated JSNA Refresh 2015 (NHS Basildon and Brentwood Clinical Commissioning Group).